Exam 23: Time-Series Analysis and Forecasting
Exam 1: What Is Statistics16 Questions
Exam 2: Types of Data, Data Collection and Sampling17 Questions
Exam 3: Graphical Descriptive Methods Nominal Data20 Questions
Exam 4: Graphical Descriptive Techniques Numerical Data64 Questions
Exam 5: Numerical Descriptive Measures150 Questions
Exam 6: Probability112 Questions
Exam 7: Random Variables and Discrete Probability Distributions55 Questions
Exam 8: Continuous Probability Distributions118 Questions
Exam 9: Statistical Inference: Introduction8 Questions
Exam 10: Sampling Distributions68 Questions
Exam 11: Estimation: Describing a Single Population132 Questions
Exam 12: Estimation: Comparing Two Populations23 Questions
Exam 13: Hypothesis Testing: Describing a Single Population130 Questions
Exam 14: Hypothesis Testing: Comparing Two Populations81 Questions
Exam 15: Inference About Population Variances47 Questions
Exam 16: Analysis of Variance125 Questions
Exam 17: Additional Tests for Nominal Data: Chi-Squared Tests116 Questions
Exam 18: Simple Linear Regression and Correlation219 Questions
Exam 19: Multiple Regression121 Questions
Exam 20: Model Building100 Questions
Exam 21: Nonparametric Techniques136 Questions
Exam 22: Statistical Inference: Conclusion106 Questions
Exam 23: Time-Series Analysis and Forecasting146 Questions
Exam 24: Index Numbers27 Questions
Exam 25: Decision Analysis51 Questions
Select questions type
In determining weekly seasonal indexes for petrol consumption, the sum of the 52 means for petrol consumption as a percentage of the moving average is 5050. To get the seasonal indexes, each weekly mean is to be multiplied by:
Free
(Multiple Choice)
4.8/5  (34)
(34)
Correct Answer: Verified
A
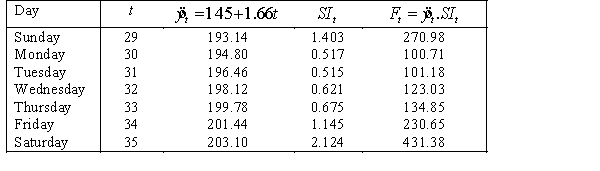
The following trend line and seasonal indexes were computed from four weeks of daily observations.  . Day S Sunday 1.403 Monday 0.517 Tuesday 0.515 Wednesday 0.621 Thursday 0.675 Friday 1.145 Saturday 2.124 Forecast the seven values for the next week.
Free
(Essay)
4.9/5 (28)
Correct Answer:Verified
We compute the three-period moving averages for all time periods except the first and last.
Free
(True/False)
4.8/5 (32)
Correct Answer:Verified
True
The trend equation for annual sales data (in millions of dollars) is  , where t = 1 for 2000. The monthly seasonal index for December is 0.97. The forecast sales for December of 2009 is:
(Multiple Choice)
4.8/5 (32)
We calculate the three-period moving average for a time series for all time periods except the first.
(True/False)
4.9/5 (27)
The quarterly sales ($millions) of a department store chain were recorded for the years 1995-1998. Year Quarter Sales 1995 1 21 2 36 3 28 4 44 1996 1 25 2 23 3 39 4 36 1997 1 30 2 41 3 47 4 55 1998 1 34 2 29 3 32 4 48 a. Calculate the four-quarter centred moving averages.
b. Graph time series and moving averages. State your conclusions about time-series smoothing?
(Essay)
4.9/5 (29)
The mean absolute deviation averages the absolute differences between the actual values of the time series at time t and the forecast values at time:
(Multiple Choice)
4.9/5 (36)
The easiest way of measuring the long-term trend is through regression analysis, where time is the dependent variable.
(True/False)
4.8/5 (44)
The Pyramids of Giza are one of the most visited monuments in Egypt. The number of visitors per quarter has been recorded (in thousands) as shown in the accompanying table: Year Quarter 1995 1996 1997 1998 Winter 210 215 218 220 Spring 260 275 282 290 Summer 480 490 505 525 Autumn 250 255 265 270 a. Plot the time series.
b. Discuss why exponential smoothing is not recommended as a forecasting method in this case.
c. Calculate the four-quarter centred moving averages.
d. Use the moving averages computed in (c) to calculate the seasonal (quarterly) indexes.
e. Use the seasonal indexes computed in (d) to deseasonalise the original time-series data, and plot the deseasonalised time series.
f. Use regression analysis to develop the trend line.
g. Use the seasonal indexes calculated in (d) and the linear trend calculated in (f) to forecast the number of visitors in the next four quarters and describe the seasonal fluctuations in the number of visitors.
(Essay)
4.7/5 (28)
Any variable that is measured over time in sequential order is called a time series.
(True/False)
4.8/5 (44)
In forecasting, we use data from the past in predicting the future value of the variable of interest.
(True/False)
4.8/5 (32)
The results of a quadratic model fit to time-series data were ?t = 7.5 -0.2t + 2.8t2, where t = 1 for 2002. The forecast value for 2011 is:
(Multiple Choice)
4.9/5 (27)
One of the simplest ways to reduce random variation is to smooth the time series via moving averages and exponential smoothing.
(True/False)
4.8/5 (32)
Monthly sales (in $1000s) of a computer store are shown below. Month Jan Feb Mar Apr May Jun Sales 73 65 72 82 86 90 a. Compute the three-month and five-month moving averages.
b. Compute the exponentially smoothed sales with w = 0.3 and w = 0.5
c. Calculate the four-month moving average, and four-month centred moving average.
(Essay)
4.9/5 (28)
Smoothing time-series data by the moving average method or exponential smoothing method is an attempt to remove the effect of the random variation component.
(True/False)
4.9/5 (41)
Which of the following will be reflected by a deseasonalised time series?
(Multiple Choice)
4.9/5 (38)
The most commonly used measures of forecast accuracy are the mean absolute deviation (MAD) and the sum of squares for forecast error (SSE).
(True/False)
4.9/5 (30)
Use exponential smoothing, with w = 0.23 to forecast the next value of the time series below. t 1 20 2 16 3 24 4 25 5 22 6 21
(Essay)
4.9/5 (38)
The following seasonal indexes and trend line were computed from five years of quarterly sales data.
Trend line: ŷt = 325 + 18.5t, t = 1, 2, 3, …20. Quarter Seasonal index 1 1.35 2 1.22 3 0.88 4 0.55 Forecast the sales for the next four quarters.
(Essay)
4.8/5 (31)
Filters
- Essay(0)
- Multiple Choice(0)
- Short Answer(0)
- True False(0)
- Matching(0)