Exam 2: Organizing and Visualizing Variables
Exam 1: Defining and Collecting Data205 Questions
Exam 2: Organizing and Visualizing Variables212 Questions
Exam 3: Numerical Descriptive Measures163 Questions
Exam 4: Basic Probability171 Questions
Exam 5: Discrete Probability Distributions117 Questions
Exam 6: The Normal Distribution144 Questions
Exam 7: Sampling Distributions127 Questions
Exam 8: Confidence Interval Estimation187 Questions
Exam 9: Fundamentals of Hypothesis Testing: One-Sample Tests177 Questions
Exam 10: Two-Sample Tests300 Questions
Exam 11: Chi-Square Tests128 Questions
Exam 12: Simple Linear Regression209 Questions
Exam 13: Multiple Regression307 Questions
Exam 14: Business Analytics254 Questions
Select questions type
SCENARIO 2-10
The relative frequency histogram below represents scores achieved by 200 job applicants on a personality profile. 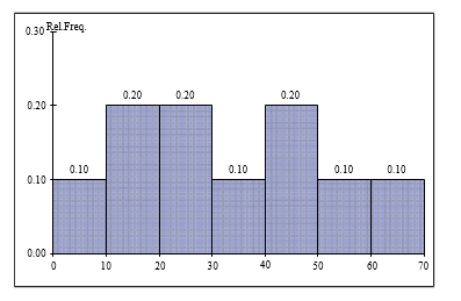 -Referring to the histogram from Scenario 2-10, 90% of the job applicants scored above or equal to .
(Short Answer)
4.9/5  (38)
(38)
SCENARIO 2-15
The figure below is the ogive for fat (in grams) for a sample of 36 pizza products where the upper boundaries of the intervals are: 5, 10, 15, 20, 25, and 30.
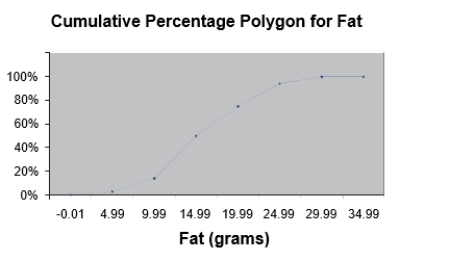 -Referring to Scenario 2-15, what percentage of pizza products contains at least 20 grams of fat?
(Multiple Choice)
4.9/5 (36)
It is essential that each class grouping or interval in a frequency distribution be and_.
(Short Answer)
4.8/5 (32)
A is a vertical bar chart in which the rectangular bars are constructed at the boundaries of each class interval.
(Short Answer)
4.9/5 (37)
The sum of cumulative frequencies in a distribution always equals 1.
(True/False)
4.8/5 (38)
SCENARIO 2-12
The table below contains the opinions of a sample of 200 people broken down by gender about the latest congressional plan to eliminate anti-trust exemptions for professional baseball. For Neutral Against Totals Female 38 54 12 104 Male 12 36 48 96 Totals 50 90 60 200
-Referring to Scenario 2-12, if the sample is a good representation of the population, we can expect percent of the population will be males.
(Short Answer)
4.8/5 (34)
SCENARIO 2-6
A sample of 200 students at a Big-Ten university was taken after the midterm to ask them whether they went bar hopping the weekend before the midterm or spent the weekend studying, and whether they did well or poorly on the midterm.The following table contains the result. Did Well in Midterm Did Poorly in Midterm Studying for Exam 80 20 Went Bar Hopping 30 70
-Referring to Scenario 2-6, if the sample is a good representation of the population, we can expectpercent of the students in the population to spend the weekend studying and do poorly on the midterm.
(Multiple Choice)
4.7/5 (37)
SCENARIO 2-5
The following are the duration in minutes of a sample of long-distance phone calls made within the continental United States reported by one long-distance carrier. Time(inMinutes) Relative Frequency 0 but less than 5 0.37 5 but less than 10 0.22 10 but less than 15 0.15 15 but less than 20 0.10 20 but less than 25 0.07 25 but less than 30 0.07 30 or more 0.02
-Referring to Scenario 2-5, what is the width of each class?
(Multiple Choice)
4.8/5 (38)
You have collected data on the responses to two questions asked in a survey of 40 college students majoring in business-What is your gender (Male = M; Female = F) and What is your major (Accountancy = A; Computer Information Systems = C; Marketing = M).Which of the following is the best for presenting the data?
(Multiple Choice)
4.8/5 (32)
SCENARIO 2-9
The frequency distribution below represents the rents of 250 randomly selected federally subsidized apartments in a small town. Rentin \ Frequency 1,100 but less than 1,200 113 1,200 but less than 1,300 85 1,300 but less than 1,400 32 1,400 but less than 1,500 16 1,500 but less than 1,600 4
-Referring to Scenario 2-9, percent of the apartments rented for at least $1,300.
(Short Answer)
4.9/5 (38)
SCENARIO 2-8
The Stem-and-Leaf display represents the number of times in a year that a random sample of 100 "lifetime" members of a health club actually visited the facility. Stem Leaves 0 01222223333334445666666667789999 1 1111222234444555669999 2 00011223455556889 3 0000446799 4 011345567 5 0077 6 8 7 67 8 3 9 0247
-Referring to Scenario 2-8, of the 100 members visited the health club no more than 12 times in a year.
(Short Answer)
4.9/5 (47)
Histograms are used for numerical data while bar charts are suitable for categorical data.
(True/False)
4.8/5 (26)
Filters
- Essay(0)
- Multiple Choice(0)
- Short Answer(0)
- True False(0)
- Matching(0)