Exam 2: Organizing and Visualizing Variables
Exam 1: Defining and Collecting Data205 Questions
Exam 2: Organizing and Visualizing Variables212 Questions
Exam 3: Numerical Descriptive Measures163 Questions
Exam 4: Basic Probability171 Questions
Exam 5: Discrete Probability Distributions117 Questions
Exam 6: The Normal Distribution144 Questions
Exam 7: Sampling Distributions127 Questions
Exam 8: Confidence Interval Estimation187 Questions
Exam 9: Fundamentals of Hypothesis Testing: One-Sample Tests177 Questions
Exam 10: Two-Sample Tests300 Questions
Exam 11: Chi-Square Tests128 Questions
Exam 12: Simple Linear Regression209 Questions
Exam 13: Multiple Regression307 Questions
Exam 14: Business Analytics254 Questions
Select questions type
SCENARIO 2-6
A sample of 200 students at a Big-Ten university was taken after the midterm to ask them whether they went bar hopping the weekend before the midterm or spent the weekend studying, and whether they did well or poorly on the midterm.The following table contains the result. Did Well in Midterm Did Poorly in Midterm Studying for Exam 80 20 Went Bar Hopping 30 70
-Referring to Scenario 2-6, percent of the students in the sample went bar hopping the weekend before the midterm and did well on the midterm.
(Multiple Choice)
4.9/5  (32)
(32)
SCENARIO 2-7
The Stem-and-Leaf display below contains data on the number of months between the date a civil suit is filed and when the case is actually adjudicated for 50 cases heard in superior court.Stem Leaves 1 234447899 2 22223455678889 3 0011135778 4 02345579 5 112466 6 158
-Referring to Scenario 2-7, if a frequency distribution with equal sized classes was made from this data, and the first class was "10 but less than 20," the cumulative percentage of the second class would be _.
(Short Answer)
4.8/5 (36)
When comparing two or more large sets of numerical data, the distributions being developed should use the same .
(Short Answer)
4.8/5 (38)
SCENARIO 2-12
The table below contains the opinions of a sample of 200 people broken down by gender about the latest congressional plan to eliminate anti-trust exemptions for professional baseball. For Neutral Against Totals Female 38 54 12 104 Male 12 36 48 96 Totals 50 90 60 200
-Referring to Scenario 2-12, percent of the 200 were females who were against the plan.
(Short Answer)
4.9/5 (32)
When constructing charts, the following is plotted at the class midpoints:
(Multiple Choice)
4.9/5 (32)
SCENARIO 2-18
The stem-and-leaf display below shows the result of a survey on 50 students on their satisfaction with their school with the higher scores represent higher level of satisfaction.  -Referring to Scenario 2-18, what was the highest level of satisfaction?
(Short Answer)
4.8/5 (31)
SCENARIO 2-9
The frequency distribution below represents the rents of 250 randomly selected federally subsidized apartments in a small town. Rentin \ Frequency 1,100 but less than 1,200 113 1,200 but less than 1,300 85 1,300 but less than 1,400 32 1,400 but less than 1,500 16 1,500 but less than 1,600 4
-Referring to Scenario 2-9, apartments rented for at least $1,200 but less than $1,400.
(Short Answer)
5.0/5 (30)
SCENARIO 2-14
The table below contains the number of people who own a portable Blu-ray player in a sample of 600 broken down by gender. Own a Portable Blu-ray player Male Female Yes 96 40 No 224 240
-Referring to Scenario 2-14, of those who did not own a portable Blu-ray player in the sample,percent were males.
(Short Answer)
4.8/5 (40)
Given below is the scatter plot of the price/earnings ratio versus earnings per share of 20 U.S.companies.There appears to be a negative relationship between price/earnings ratio and earnings per share. 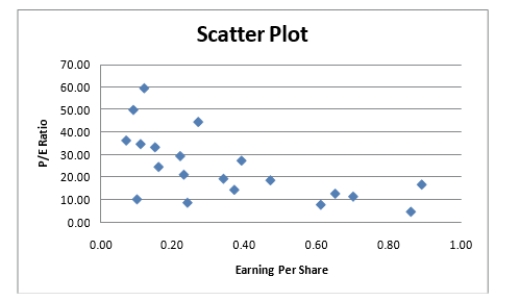
(True/False)
4.7/5 (42)
SCENARIO 2-14
The table below contains the number of people who own a portable Blu-ray player in a sample of 600 broken down by gender. Own a Portable Blu-ray player Male Female Yes 96 40 No 224 240
-Referring to Scenario 2-14, if the sample is a good representation of the population, we can expect percent of the population will be males.
(Short Answer)
4.8/5 (44)
SCENARIO 2-13
Given below is the stem-and-leaf display representing the amount of detergent used in gallons (with leaves in 10ths of gallons) in a day by 25 drive-through car wash operations in Phoenix. 9\mid147 10\mid02238 11\mid135566777 12\mid223489 13\mid02
-Referring to Scenario 2-13, construct a relative frequency or percentage distribution for the detergent data, using "9.0 but less than 10.0" as the first class.
(Short Answer)
4.8/5 (29)
In general, grouped frequency distributions should have between 5 and 15 class intervals.
(True/False)
4.8/5 (38)
The original data values cannot be determined once they are grouped into a frequency distribution table.
(True/False)
4.8/5 (41)
SCENARIO 2-5
The following are the duration in minutes of a sample of long-distance phone calls made within the continental United States reported by one long-distance carrier. Time(inMinutes) Relative Frequency 0 but less than 5 0.37 5 but less than 10 0.22 10 but less than 15 0.15 15 but less than 20 0.10 20 but less than 25 0.07 25 but less than 30 0.07 30 or more 0.02
-Referring to Scenario 2-5, if 100 calls were randomly sampled, how many calls lasted 15 minutes or longer?
(Multiple Choice)
4.9/5 (38)
SCENARIO 2-8
The Stem-and-Leaf display represents the number of times in a year that a random sample of 100 "lifetime" members of a health club actually visited the facility. Stem Leaves 0 01222223333334445666666667789999 1 1111222234444555669999 2 00011223455556889 3 0000446799 4 011345567 5 0077 6 8 7 67 8 3 9 0247
-Referring to Scenario 2-8, the person who has the largest leaf associated with the smallest stem visited the facility times.
(Short Answer)
4.7/5 (33)
When you work with many variables, you must be mindful of the limits of the information technology as well as the limits of the ability of your readers to perceive and comprehend your results.
(True/False)
4.8/5 (32)
Data on the number of part-time hours students at a public university worked in a week were collected.Which of the following is the best chart for presenting the information?
(Multiple Choice)
4.9/5 (32)
When studying the simultaneous responses to two categorical questions, you should set up a
(Multiple Choice)
4.8/5 (22)
The Best Practices for Creating Visual Summaries recommend always starting the scale for a vertical axis at zero.
(True/False)
4.9/5 (35)
SCENARIO 2-13
Given below is the stem-and-leaf display representing the amount of detergent used in gallons (with leaves in 10ths of gallons) in a day by 25 drive-through car wash operations in Phoenix. 9\mid147 10\mid02238 11\mid135566777 12\mid223489 13\mid02
-Referring to Scenario 2-13, if a frequency distribution for the amount of detergent used is constructed, using "9.0 but less than 10.0 gallons" as the first class, the frequency of the "11.0 but less than 12.0 gallons" class would be .
(Short Answer)
4.8/5 (26)
Filters
- Essay(0)
- Multiple Choice(0)
- Short Answer(0)
- True False(0)
- Matching(0)