Exam 2: Organizing and Visualizing Variables
Exam 1: Defining and Collecting Data205 Questions
Exam 2: Organizing and Visualizing Variables212 Questions
Exam 3: Numerical Descriptive Measures163 Questions
Exam 4: Basic Probability171 Questions
Exam 5: Discrete Probability Distributions117 Questions
Exam 6: The Normal Distribution144 Questions
Exam 7: Sampling Distributions127 Questions
Exam 8: Confidence Interval Estimation187 Questions
Exam 9: Fundamentals of Hypothesis Testing: One-Sample Tests177 Questions
Exam 10: Two-Sample Tests300 Questions
Exam 11: Chi-Square Tests128 Questions
Exam 12: Simple Linear Regression209 Questions
Exam 13: Multiple Regression307 Questions
Exam 14: Business Analytics254 Questions
Select questions type
SCENARIO 2-14
The table below contains the number of people who own a portable Blu-ray player in a sample of 600 broken down by gender. Own a Portable Blu-ray player Male Female Yes 96 40 No 224 240
-Referring to Scenario 2-14, if the sample is a good representation of the population, we can expect percent of the males in the population will own a portable Blu-ray player.
(Short Answer)
4.8/5  (30)
(30)
SCENARIO 2-5
The following are the duration in minutes of a sample of long-distance phone calls made within the continental United States reported by one long-distance carrier. Time(inMinutes) Relative Frequency 0 but less than 5 0.37 5 but less than 10 0.22 10 but less than 15 0.15 15 but less than 20 0.10 20 but less than 25 0.07 25 but less than 30 0.07 30 or more 0.02
-Referring to Scenario 2-5, if 100 calls were sampled, of them would have lasted less than 15 minutes.
(Multiple Choice)
4.9/5 (39)
SCENARIO 2-14
The table below contains the number of people who own a portable Blu-ray player in a sample of 600 broken down by gender. Own a Portable Blu-ray player Male Female Yes 96 40 No 224 240
-Referring to Scenario 2-14, of the males in the sample, percent owned a portableBlu-ray player.
(Short Answer)
4.9/5 (31)
Relationships in a contingency table can be examined more fully if the frequencies are converted into .
(Short Answer)
4.8/5 (35)
The Best Practices for Creating Visual Summaries recommend using varying scale to conserve precious space whenever possible.
(True/False)
4.8/5 (34)
The percentage distribution cannot be constructed from the frequency distribution directly.
(True/False)
4.8/5 (27)
SCENARIO 2-11
The ordered array below resulted from selecting a sample of 25 batches of 500 computer chips and determining how many in each batch were defective. Defects 1 2 4 4 5 5 6 7 9 9 12 12 15 17 20 21 23 23 25 26 27 27 28 29 29
-Referring to Scenario 2-11, if a frequency distribution for the defects data is constructed, using "0 but less than 5" as the first class, the relative frequency of the "15 but less than 20" class wouldbe _.
(Short Answer)
4.9/5 (30)
SCENARIO 2-5
The following are the duration in minutes of a sample of long-distance phone calls made within the continental United States reported by one long-distance carrier. Time(inMinutes) Relative Frequency 0 but less than 5 0.37 5 but less than 10 0.22 10 but less than 15 0.15 15 but less than 20 0.10 20 but less than 25 0.07 25 but less than 30 0.07 30 or more 0.02
-Referring to Scenario 2-5, if 100 calls were randomly sampled, of them would have lasted at least 15 minutes but less than 20 minutes
(Multiple Choice)
4.8/5 (35)
Data on the number of credit hours of 20,000 students at a public university enrolled in a Spring semester were collected.Which of the following is the best for presenting the information?
(Multiple Choice)
4.8/5 (32)
SCENARIO 2-13
Given below is the stem-and-leaf display representing the amount of detergent used in gallons (with leaves in 10ths of gallons) in a day by 25 drive-through car wash operations in Phoenix. 9\mid147 10\mid02238 11\mid135566777 12\mid223489 13\mid02
-Referring to Scenario 2-13, construct a percentage histogram for the detergent data, using "9.0 but less than 10.0" as the first class.
(Short Answer)
4.8/5 (36)
SCENARIO 2-12
The table below contains the opinions of a sample of 200 people broken down by gender about the latest congressional plan to eliminate anti-trust exemptions for professional baseball. For Neutral Against Totals Female 38 54 12 104 Male 12 36 48 96 Totals 50 90 60 200
-Referring to Scenario 2-12, construct a table of row percentages.
(Short Answer)
4.8/5 (35)
In constructing a polygon, each class grouping is represented by its and then these are consecutively connected to one another.
(Short Answer)
4.8/5 (35)
SCENARIO 2-12
The table below contains the opinions of a sample of 200 people broken down by gender about the latest congressional plan to eliminate anti-trust exemptions for professional baseball. For Neutral Against Totals Female 38 54 12 104 Male 12 36 48 96 Totals 50 90 60 200
-Referring to Scenario 2-12, percent of the 200 were males.
(Short Answer)
4.7/5 (39)
SCENARIO 2-14
The table below contains the number of people who own a portable Blu-ray player in a sample of 600 broken down by gender. Own a Portable Blu-ray player Male Female Yes 96 40 No 224 240
-Referring to Scenario 2-14, percent of the 600 did not own a portable Blu-ray player.
(Short Answer)
4.9/5 (25)
SCENARIO 2-12
The table below contains the opinions of a sample of 200 people broken down by gender about the latest congressional plan to eliminate anti-trust exemptions for professional baseball. For Neutral Against Totals Female 38 54 12 104 Male 12 36 48 96 Totals 50 90 60 200
-Referring to Scenario 2-12, percent of the 200 were against the plan.
(Short Answer)
4.8/5 (44)
SCENARIO 2-14
The table below contains the number of people who own a portable Blu-ray player in a sample of 600 broken down by gender. Own a Portable Blu-ray player Male Female Yes 96 40 No 224 240
-Referring to Scenario 2-14, construct a table of total percentages.
(Short Answer)
4.9/5 (34)
SCENARIO 2-10
The relative frequency histogram below represents scores achieved by 200 job applicants on a personality profile. 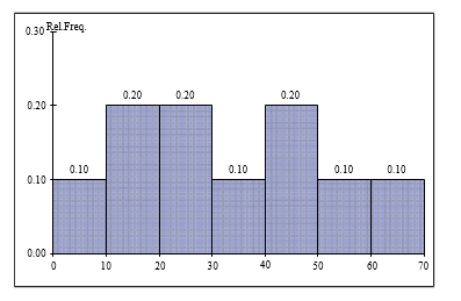 -Referring to the histogram from Scenario 2-10, percent of the applicants scored below20 or at least 50.
(Short Answer)
4.9/5 (40)
SCENARIO 2-7
The Stem-and-Leaf display below contains data on the number of months between the date a civil suit is filed and when the case is actually adjudicated for 50 cases heard in superior court.Stem Leaves 1 234447899 2 22223455678889 3 0011135778 4 02345579 5 112466 6 158
-Referring to Scenario 2-7, if a frequency distribution with equal sized classes was made from this data, and the first class was "10 but less than 20," the relative frequency of the third class would be _.
(Short Answer)
4.9/5 (41)
A is a summary table in which numerical data are tallied into class intervals or categories.
(Short Answer)
4.9/5 (38)
SCENARIO 2-13
Given below is the stem-and-leaf display representing the amount of detergent used in gallons (with leaves in 10ths of gallons) in a day by 25 drive-through car wash operations in Phoenix. 9\mid147 10\mid02238 11\mid135566777 12\mid223489 13\mid02
-Referring to Scenario 2-13, if a relative frequency or percentage distribution for the detergent data is constructed, using "9.0 but less than 10.0 gallons" as the first class, what percentage of drive-through car wash operations use at least 10 gallons of detergent in a day?
(Short Answer)
5.0/5 (26)
Filters
- Essay(0)
- Multiple Choice(0)
- Short Answer(0)
- True False(0)
- Matching(0)