Exam 2: Organizing and Visualizing Variables
Exam 1: Defining and Collecting Data205 Questions
Exam 2: Organizing and Visualizing Variables212 Questions
Exam 3: Numerical Descriptive Measures163 Questions
Exam 4: Basic Probability171 Questions
Exam 5: Discrete Probability Distributions117 Questions
Exam 6: The Normal Distribution144 Questions
Exam 7: Sampling Distributions127 Questions
Exam 8: Confidence Interval Estimation187 Questions
Exam 9: Fundamentals of Hypothesis Testing: One-Sample Tests177 Questions
Exam 10: Two-Sample Tests300 Questions
Exam 11: Chi-Square Tests128 Questions
Exam 12: Simple Linear Regression209 Questions
Exam 13: Multiple Regression307 Questions
Exam 14: Business Analytics254 Questions
Select questions type
The relative frequency is the frequency in each class divided by the total number of observations.
(True/False)
4.9/5  (31)
(31)
SCENARIO 2-17
The following table presents total retail sales in millions of dollars for the leading apparel companies over a two-year period in the past. APPAREL COMPANY Year 1 Year 2 Gap 1,159.0 962.0 TJX 781.7 899.0 Limited 596.5 620.4 Kohl's 544.9 678.9 Nordstrom 402.6 418.3 Talbots 139.9 130.1 Ann Taylor 114.2 124.8
-Referring to Scenario 2-17, among the 8 stores, saw a sales decline.
(Short Answer)
4.7/5 (37)
SCENARIO 2-14
The table below contains the number of people who own a portable Blu-ray player in a sample of 600 broken down by gender. Own a Portable Blu-ray player Male Female Yes 96 40 No 224 240
-Referring to Scenario 2-14, of those who owned a portable Blu-ray player in the sample,percent were females.
(Short Answer)
4.8/5 (34)
SCENARIO 2-8
The Stem-and-Leaf display represents the number of times in a year that a random sample of 100 "lifetime" members of a health club actually visited the facility. Stem Leaves 0 01222223333334445666666667789999 1 1111222234444555669999 2 00011223455556889 3 0000446799 4 011345567 5 0077 6 8 7 67 8 3 9 0247
-Referring to Scenario 2-8, of the 100 members visited the health club at least 52 times in a year.
(Short Answer)
4.7/5 (33)
SCENARIO 2-16
The figure below is the percentage polygon for the number of calories for a sample of 36 pizzas products where the upper limits of the intervals are: 310, 340, 370, 400 and 430. 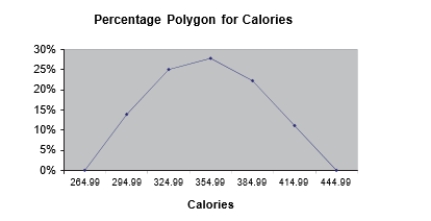 -Referring to Scenario 2-16, roughly what percentage of pizza products contains between 340 and 400 calories?
(Multiple Choice)
4.9/5 (43)
SCENARIO 2-12
The table below contains the opinions of a sample of 200 people broken down by gender about the latest congressional plan to eliminate anti-trust exemptions for professional baseball. For Neutral Against Totals Female 38 54 12 104 Male 12 36 48 96 Totals 50 90 60 200
-Referring to Scenario 2-12, of those for the plan in the sample, percent were females.
(Short Answer)
4.7/5 (30)
SCENARIO 2-12
The table below contains the opinions of a sample of 200 people broken down by gender about the latest congressional plan to eliminate anti-trust exemptions for professional baseball. For Neutral Against Totals Female 38 54 12 104 Male 12 36 48 96 Totals 50 90 60 200
-Referring to Scenario 2-12, construct a table of total percentages.
(Short Answer)
4.7/5 (38)
SCENARIO 2-7
The Stem-and-Leaf display below contains data on the number of months between the date a civil suit is filed and when the case is actually adjudicated for 50 cases heard in superior court.Stem Leaves 1 234447899 2 22223455678889 3 0011135778 4 02345579 5 112466 6 158
-Referring to Scenario 2-7, percent of the cases were adjudicated within the first 2 years.
(Short Answer)
4.9/5 (24)
You have collected data on the monthly seasonally adjusted civilian unemployment rate for theUnited States over a 10-year period.Which of the following is the best for presenting the data?
(Multiple Choice)
4.8/5 (32)
The point halfway between the boundaries of each class interval in a grouped frequency distribution is called the _.
(Short Answer)
4.8/5 (41)
SCENARIO 2-14
The table below contains the number of people who own a portable Blu-ray player in a sample of 600 broken down by gender. Own a Portable Blu-ray player Male Female Yes 96 40 No 224 240
-Referring to Scenario 2-14, construct a table of column percentages.
(Short Answer)
4.8/5 (38)
SCENARIO 2-5
The following are the duration in minutes of a sample of long-distance phone calls made within the continental United States reported by one long-distance carrier. Time(inMinutes) Relative Frequency 0 but less than 5 0.37 5 but less than 10 0.22 10 but less than 15 0.15 15 but less than 20 0.10 20 but less than 25 0.07 25 but less than 30 0.07 30 or more 0.02
-Referring to Scenario 2-5, what is the cumulative relative frequency for the percentage of calls that lasted 10 minutes or more?
(Multiple Choice)
5.0/5 (37)
SCENARIO 2-5
The following are the duration in minutes of a sample of long-distance phone calls made within the continental United States reported by one long-distance carrier. Time(inMinutes) Relative Frequency 0 but less than 5 0.37 5 but less than 10 0.22 10 but less than 15 0.15 15 but less than 20 0.10 20 but less than 25 0.07 25 but less than 30 0.07 30 or more 0.02
-Referring to Scenario 2-5, if 100 calls were sampled, of them would have lasted less than 5 minutes or at least 30 minutes or more.
(Multiple Choice)
4.9/5 (45)
SCENARIO 2-9
The frequency distribution below represents the rents of 250 randomly selected federally subsidized apartments in a small town. Rentin \ Frequency 1,100 but less than 1,200 113 1,200 but less than 1,300 85 1,300 but less than 1,400 32 1,400 but less than 1,500 16 1,500 but less than 1,600 4
-Referring to Scenario 2-9, the relative frequency of the second class is .
(Short Answer)
4.9/5 (46)
SCENARIO 2-8
The Stem-and-Leaf display represents the number of times in a year that a random sample of 100 "lifetime" members of a health club actually visited the facility. Stem Leaves 0 01222223333334445666666667789999 1 1111222234444555669999 2 00011223455556889 3 0000446799 4 011345567 5 0077 6 8 7 67 8 3 9 0247
-Referring to Scenario 2-8, if a frequency distribution with equal sized classes was made from this data, and the first class was "0 but less than 10," the relative frequency of the last class would be_.
(Short Answer)
4.8/5 (23)
The larger the number of observations in a numerical data set, the larger the number of class intervals needed for a grouped frequency distribution.
(True/False)
4.8/5 (33)
SCENARIO 2-4
A survey was conducted to determine how people rated the quality of programming available on television.Respondents were asked to rate the overall quality from 0 (no quality at all) to 100 (extremely good quality).The stem-and-leaf display of the data is shown below. Stem Leaves 3 24 4 03478999 5 0112345 6 12566 7 01 8 9 2
-Referring to Scenario 2-4, what percentage of the respondents rated overall television quality with a rating of 80 or above?
(Multiple Choice)
4.8/5 (27)
SCENARIO 2-14
The table below contains the number of people who own a portable Blu-ray player in a sample of 600 broken down by gender. Own a Portable Blu-ray player Male Female Yes 96 40 No 224 240
-Referring to Scenario 2-14, percent of the 600 were males who owned a portableBlu-ray player.
(Short Answer)
4.8/5 (40)
Data on 1,500 students' height were collected at a larger university in the East Coast.Which of the following is the best chart for presenting the information?
(Multiple Choice)
4.8/5 (39)
Filters
- Essay(0)
- Multiple Choice(0)
- Short Answer(0)
- True False(0)
- Matching(0)