Exam 26: Statistics and Data Analysis
Exam 1: Data and Decisions29 Questions
Exam 2: Visualizing and Describing Categorical Data30 Questions
Exam 3: Describing, Displaying, and Visualizing Quantitative Data16 Questions
Exam 4: Correlation and Linear Regression21 Questions
Exam 5: Randomness and Probability22 Questions
Exam 6: Random Variables and Probability Models20 Questions
Exam 7: The Normal and Other Continuous Distributions20 Questions
Exam 8: Data Sources: Observational Studies and Surveys23 Questions
Exam 9: Data Sources: Experiments12 Questions
Exam 10: Sampling Distributions and Confidence Intervals for Proportio18 Questions
Exam 11: Confidence Intervals for Means20 Questions
Exam 12: Testing Hypotheses21 Questions
Exam 13: More About Tests and Intervals16 Questions
Exam 14: Comparing Two Means13 Questions
Exam 15: Inference for Counts: Chi-Square Tests17 Questions
Exam 16: Inference for Regression19 Questions
Exam 17: Understanding Residuals19 Questions
Exam 18: Multiple Regression18 Questions
Exam 19: Building Multiple Regression Models16 Questions
Exam 20: Time Series Analysis18 Questions
Exam 21: Introduction to Data Mining11 Questions
Exam 22: Quality Control20 Questions
Exam 23: Nonparametric Methods13 Questions
Exam 24: Decision Making and Risk19 Questions
Exam 25: Analysis of Experiments and Observational Studies9 Questions
Exam 26: Statistics and Data Analysis207 Questions
Select questions type
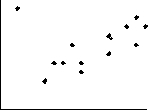
If the point in the upper left corner of the scatterplot shown below is removed, what will happen to the correlation (r) and the slope of the line of best fit (b)?
(Multiple Choice)
4.8/5  (26)
(26)
For the following data, the forecasted monthly return for January 2008 using a three-month moving average is ________________________ .

(Multiple Choice)
4.8/5 (40)
Which is true for the data shown in the histogram?
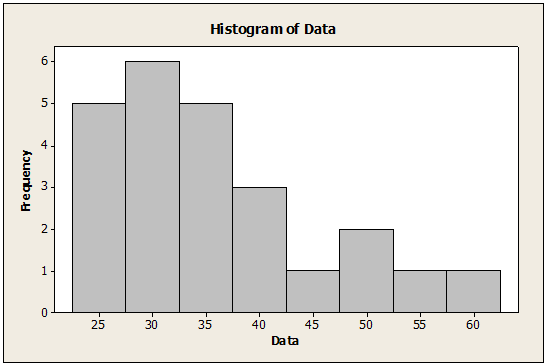 I.The distribution is skewed to the right.
II.The mean is probably smaller than the median.
III.It is appropriate to summarize these data with the mean and standard deviation.
I.The distribution is skewed to the right.
II.The mean is probably smaller than the median.
III.It is appropriate to summarize these data with the mean and standard deviation.
(Multiple Choice)
4.9/5 (34)
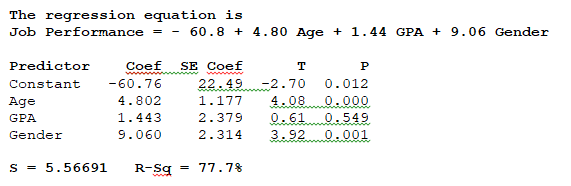
According to the multiple regression model to predict the job performance of new hires based on age, GPA and gender (female = 1 and male = 0) shown below, how much of the variability in Job Performance is explained by the model?
(Multiple Choice)
4.9/5 (33)
Suppose that a Normal model describes fuel economy (miles per gallon) for automobiles and that a Toyota Corolla has a standardized score (z-score) of +2.2.This means that Corollas ________________________ .
(Multiple Choice)
4.9/5 (37)
A researcher is conducting a study on eating disorders.Using a list of recent participants in the online Weight Watchers program, she randomly selects a sample from the alphabetized list.This list represents the ________________________ .
(Multiple Choice)
4.7/5 (33)
Suppose that a textile manufacturer finds is an average of 5.5 defects per 100 square foot sections of carpet as part of its quality assurance program.The lower and upper control limits for the appropriate control chart for these data are ________________________ .
(Multiple Choice)
4.7/5 (47)
College students were given three choices of pizza toppings and asked to choose one favorite.The following table shows the results.
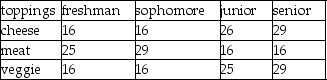 Find P(favorite topping is veggie | student is junior or senior).
(Multiple Choice)
4.9/5 (28)
An advocacy group is interested in determining if gender (1 = Female, 2 = Male) affects executive level salaries.They take a random sample of executives in three different industries: (1 = Consumer Goods, 2 = Financial, 3 = Health Care).Salary data are collected.Which of the following statements is TRUE?
I.This is an experimental study.
II.This is an observational study.
III.This is a randomized block design.
GLOBAL : Please check spacing
(Multiple Choice)
4.8/5 (38)
A major customer for a vendor of plastic containers requires that its containers have a volume of 10,000 cubic inches with a tolerance of 50 cubic inches.Forty subgroups of five containers each were selected periodically from the production process.The average of the means across all subgroups was found to be 10,012 cubic inches and the average range was 48 cubic inches.What is the Cp index?
(Multiple Choice)
4.8/5 (21)
Which of the following is not an assumption or condition that needs to be checked for a two-sample t-test for the difference between two means?
(Multiple Choice)
4.8/5 (28)
A truck company wants on-time delivery for 98% of the parts they order from a metal manufacturing plant.They have been ordering from Hudson Manufacturing but will switch to a new, cheaper manufacturer (Steel-R-Us) unless there is evidence that this new manufacturer cannot meet the 98% on-time goal.As a test the truck company purchases a random sample of metal parts from Steel-R-Us, and then determines if these parts were delivered on-time.Which hypotheses should they test?
(Multiple Choice)
4.9/5 (41)
As a preliminary step in its product testing, a fast food chain has two small groups (4 teenagers, 6 older adults) sample the item and "grade" it on "taste." According to the data below, what is the value of an appropriate nonparametric test statistic to determine if the two groups differ in opinion?
GLOBAL : Please place the table above the answers

(Multiple Choice)
4.9/5 (25)
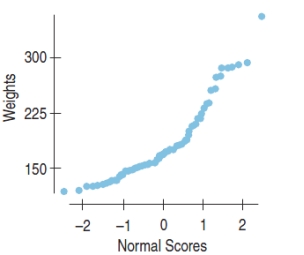
A Normal probability plot of the weights of individuals signed up for a popular diet program is shown below.The best description of the plot is
(Multiple Choice)
4.8/5 (28)
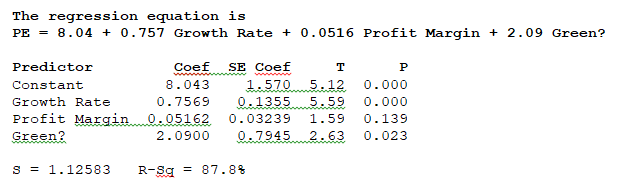
Based on the output below from regression analysis performed to develop a model for predicting a firm's Price-Earnings Ratio (PE) based on Growth Rate, Profit Margin, and whether or not the firm is Green (1 = Yes, 0 = No), we can conclude (α = .05) that ________________________ .
(Multiple Choice)
4.7/5 (37)
A manufacturer of solid wood cabinetry requires that its lumber has moisture content (MC) between 5% and 9%.Twenty-five subgroups, each consisting of six pieces of lumber, yield an average MC of 6.95% and an average range of 2.2%.What is the Cpk index?
(Multiple Choice)
4.9/5 (38)
A men's clothing store has determined the following probability distribution for the number of special size orders placed per month.Based on this distribution, the standard deviation in the number of special size orders placed per month is ________________________ .

(Multiple Choice)
4.7/5 (39)
To initiate control charting, twenty-five samples of size five are periodically taken and the resistance (in ohms) of each copper wire is measured.An appropriate control chart to use for these data is the ________________________ .
(Multiple Choice)
4.9/5 (43)
Determine whether the events of rolling a fair die two times are disjoint, independent, both, or neither.
One line space needed
(Multiple Choice)
4.8/5 (36)
The regression equation to predict the job performance of new hires based on age, GPA and gender (female = 1 and male = 0) is
 Which of the following is the correct interpretation for the regression coefficient of Gender?
(Multiple Choice)
4.8/5 (34)
Filters
- Essay(0)
- Multiple Choice(0)
- Short Answer(0)
- True False(0)
- Matching(0)