Exam 26: Statistics and Data Analysis
Exam 1: Data and Decisions29 Questions
Exam 2: Visualizing and Describing Categorical Data30 Questions
Exam 3: Describing, Displaying, and Visualizing Quantitative Data16 Questions
Exam 4: Correlation and Linear Regression21 Questions
Exam 5: Randomness and Probability22 Questions
Exam 6: Random Variables and Probability Models20 Questions
Exam 7: The Normal and Other Continuous Distributions20 Questions
Exam 8: Data Sources: Observational Studies and Surveys23 Questions
Exam 9: Data Sources: Experiments12 Questions
Exam 10: Sampling Distributions and Confidence Intervals for Proportio18 Questions
Exam 11: Confidence Intervals for Means20 Questions
Exam 12: Testing Hypotheses21 Questions
Exam 13: More About Tests and Intervals16 Questions
Exam 14: Comparing Two Means13 Questions
Exam 15: Inference for Counts: Chi-Square Tests17 Questions
Exam 16: Inference for Regression19 Questions
Exam 17: Understanding Residuals19 Questions
Exam 18: Multiple Regression18 Questions
Exam 19: Building Multiple Regression Models16 Questions
Exam 20: Time Series Analysis18 Questions
Exam 21: Introduction to Data Mining11 Questions
Exam 22: Quality Control20 Questions
Exam 23: Nonparametric Methods13 Questions
Exam 24: Decision Making and Risk19 Questions
Exam 25: Analysis of Experiments and Observational Studies9 Questions
Exam 26: Statistics and Data Analysis207 Questions
Select questions type
A major customer for a vendor of plastic containers requires that its containers have a volume of 10,000 cubic inches with a tolerance of 50 cubic inches.Forty subgroups of five containers each were selected periodically from the production process.The average of the means across all subgroups was found to be 10,012 cubic inches and the average range was 48 cubic inches.The lower and upper control limits for the R chart are ________________________ .
(Multiple Choice)
4.9/5  (39)
(39)
A customer service center keeps track of the number of complaints received each day about one of their new products.The numbers of complaints received over the last 11 day period are 19, 18, 22, 21, 17, 18, 22, 19, 16, 23, and 25.The IQR for this sample of data is
(Multiple Choice)
4.7/5 (39)
A type II error is committed when ________________________ .
(Multiple Choice)
4.8/5 (42)
To investigate length of battery life while accounting for the device the battery lives in, an experiment is run once for each combination of brand of AAA batteries and device (TV remote, hand-held game, flashlight and digital camera).The twelve runs are ordered randomly.The time (in minutes) that each battery lasts under continuous usage is recorded.Which of the following statements is true about this design?
(Multiple Choice)
4.9/5 (39)
Suppose that over the last 20 weeks, a law firm had a total of 1045 consultation calls, and that 126 of them did not get an appointment for an initial consult within 24 hours.The centerline on the appropriate control chart for these data is ________________________ .
(Multiple Choice)
4.8/5 (27)
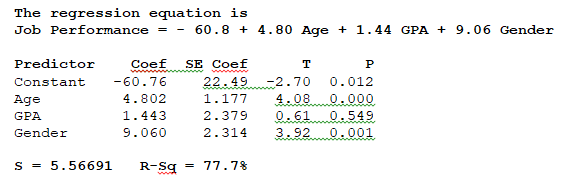
The results of a multiple regression model to predict the job performance of new hires based on age, GPA and gender (female = 1 and male = 0 are shown below.At
Α = .05 we can conclude that ________________________ .
(Multiple Choice)
4.8/5 (41)
Using this regression equation: Salary = 37.2 + 1.49 Years' Experience to predict salary for pharmacists with 10 years of experience gives the following results.Which of the following is true?

(Multiple Choice)
4.9/5 (41)
The weather reporter predicts that there is a 20% chance of snow tomorrow for a certain region.What is meant by this phrase?
One line space needed
(Multiple Choice)
4.8/5 (36)
The time series graph below shows monthly sales figures for a specialty gift item sold on the Home Shopping Network (HSN).The dominant component in these data is ________________________ .
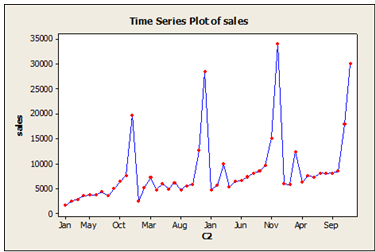
(Multiple Choice)
4.7/5 (44)
A magazine that publishes product reviews conducted a survey of teenagers' preferences for cell phones.Three brands of cell phone designed specifically with teens in mind were the focus of the study.The table summarizes responses by brand and gender.What percent of teenagers preferred LG Rumor?

(Multiple Choice)
4.8/5 (35)
A company that processes wheat varies the milling time (short, medium and long) and bleaching (no bleaching and bleaching) and measure fiber content (gms/100 grams) of the resulting wheat product to determine the best combination for a desirable wheat product.According to ANOVA results below, the F statistic for testing whether bleaching has an effect on fiber content is ________________________ .
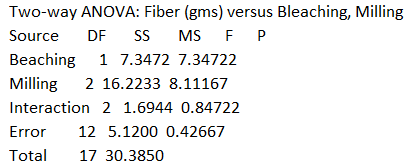
(Multiple Choice)
4.9/5 (33)
The following scatterplot shows output/unit capital and years.The data show
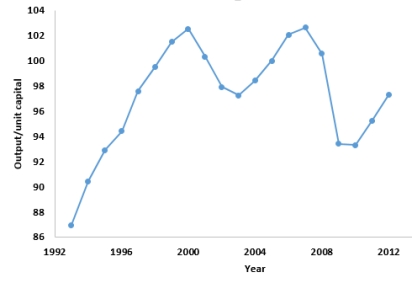
(Multiple Choice)
4.9/5 (47)
The following scatterplot shows monthly sales figures (in units) and number of months of experience on the job for a sample of 19 salespeople.Describe the association between monthly sales and level of experience.
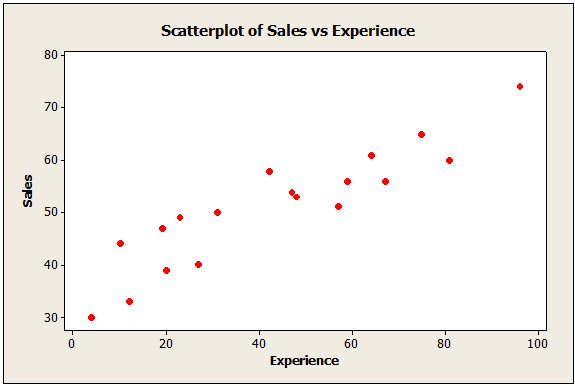
(Multiple Choice)
4.9/5 (38)
After computing a confidence interval, the investigator believes that the results are meaningless because the width of the interval is too large.In reconstructing the interval, the investigator should ________________________ .
(Multiple Choice)
4.8/5 (37)
Suppose the time it takes for a purchasing agent to complete an online ordering process is normally distributed with a mean of 8 minutes and a standard deviation of 2 minutes.What is the probability that it takes longer than 11 minutes for the purchasing agent to complete the process?
(Multiple Choice)
4.8/5 (38)
Data were analyzed to see if income level (1 = Low, 2 = Middle, 3 = High) influence the amount consumers spend online for holiday shopping.Based on the ANOVA results shown below, the F statistic value is ________________________ .
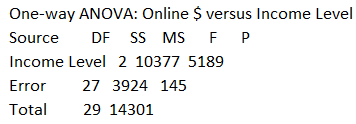
(Multiple Choice)
4.9/5 (36)
Boxplots of earnings per share (EPS) data for a sample of retail company stocks and a sample of energy company stocks are shown below.Which of the following statements is correct?
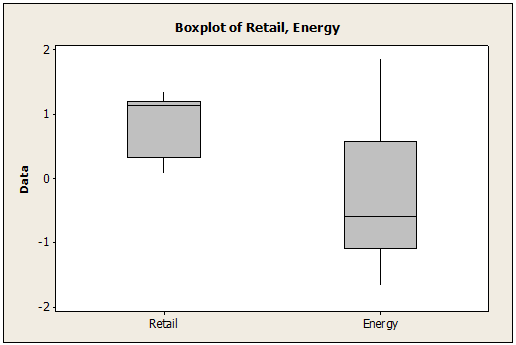
(Multiple Choice)
5.0/5 (34)
In order to see which variety of apple tree produces more fruit, a farmer sets up an experiment.He has three plots of land with different soil and natural water availability.Each plot has room for eight trees.The farmer randomly selects four locations in each plot for the first variety of tree and the other four get the second variety.This experiment is ________________________ .
(Multiple Choice)
4.8/5 (33)
Because a medical experiment makes use of volunteers ________________________ .
(Multiple Choice)
4.8/5 (34)
Filters
- Essay(0)
- Multiple Choice(0)
- Short Answer(0)
- True False(0)
- Matching(0)