Exam 14: Chi-Square Applications for Nominal Data
Exam 1: What Is Statistics78 Questions
Exam 2: Describing Data: Frequency Distributions and Graphic Presentation101 Questions
Exam 3: Describing Data: Numerical Measures186 Questions
Exam 4: A Survey of Probability Concepts121 Questions
Exam 5: Discrete Probability Distributions111 Questions
Exam 6: The Normal Probability Distribution129 Questions
Exam 7: Sampling Methods and the Central Limit Theorem78 Questions
Exam 8: Estimation and Confidence Intervals128 Questions
Exam 9: One-Sample Tests of a Hypothesis223 Questions
Exam 10: Two-Sample Tests of Hypothesis87 Questions
Exam 11: Analysis of Variance80 Questions
Exam 12: Linear Regression and Correlation150 Questions
Exam 13: Multiple Regression and Correlation Analysis98 Questions
Exam 14: Chi-Square Applications for Nominal Data113 Questions
Exam 15: Index Numbers65 Questions
Exam 16: Time Series and Forecasting86 Questions
Exam 17: An Introduction to Decision Theory37 Questions
Select questions type
A survey of the opinions of property owners about a street widening project was taken to determine whether the resulting opinion was related to the distance of front footage. A randomly selected sample of 100 property owners was contacted and the results are shown below. 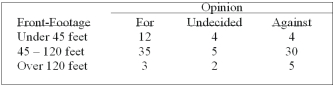 If the computed chi-square is 8.5, what is your decision at the 5% level of significance? What is your decision at the 1% level of significance?
Free
(Multiple Choice)
4.8/5  (27)
(27)
Correct Answer: Verified
A
A student asked a statistics professor if grades were marked "on the curve." The professor decided to give the student a project to determine if last year's statistics grades were normally distributed. The professor told the student that last year's mean mark was 70 with a standard deviation of 10 and to use the following results.  What is the critical value of chi-square at the .05 level?
Free
(Multiple Choice)
4.8/5 (34)
Correct Answer:Verified
B
The following table classifies an individual in two ways-by gender and by educational choice. 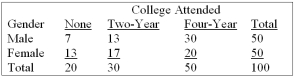 What is this two-way classification called?
Free
(Multiple Choice)
4.9/5 (37)
Correct Answer:Verified
D
i. The sum of the expected frequencies and the sum of the observed frequencies must be equal.
ii. If the computed value of chi-square is less than the critical value, reject the null hypothesis at a predetermined level of significance.
Iii) If there are only two cells in a goodness-of-fit test, we should expect 5 or more frequencies.
(Multiple Choice)
4.7/5 (42)
To analyze data cross-classified in a contingency table, how are the degrees of freedom found?
(Multiple Choice)
4.8/5 (37)
At a recent automobile show, a sample of 125 people produced the following results. Use the 0.01 significance level to determine if there is a relationship between age and model preferred. 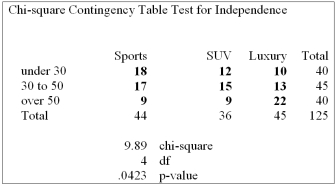 Based on the analysis above, what can be concluded?
(Multiple Choice)
4.7/5 (34)
i. The sum of the expected frequencies in a goodness-of-fit test need not equal the sum of the observed frequencies.
ii. A goodness-of-fit test is a nonparametric test involving a set of observed frequencies and a corresponding set of expected frequencies.
Iii) For a goodness-of-fit test, the following are possible null and alternate hypotheses; Null: Sales are uniformly distributed among the five locations.; Alternate: Sales are not uniformly distributed among the five locations.
(Multiple Choice)
4.7/5 (45)
A student asked a statistics professor if grades were marked "on the curve." The professor decided to give the student a project to determine if last year's statistics grades were normally distributed. The professor told the student that last year's mean mark was 70 with a standard deviation of 10 and to use the following results. 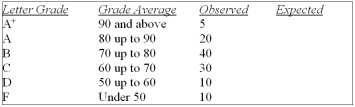 What is the calculated value of chi-square?
(Multiple Choice)
4.9/5 (24)
Which of the following can be used to test if two nominal variables or characteristics are related?
(Multiple Choice)
4.9/5 (33)
Recently, students in a marketing research class were interested in the driving behavior of students. Specifically, the marketing students were interested if exceeding the speed limit was related to gender. They collected the following responses from 100 randomly selected students: 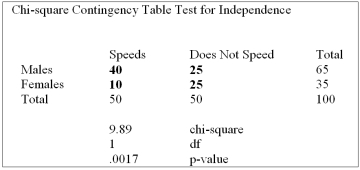 Using the output from Megastat for the data given, what can you conclude?
(Multiple Choice)
4.8/5 (34)
The following table shows the adjustment to civilian life and place of residence. 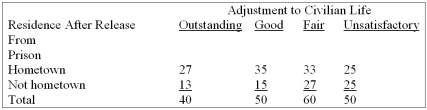 What is the critical value for this contingency table at the 0.01 level of significance?
(Multiple Choice)
4.8/5 (42)
The personnel manager is concerned about absenteeism. She decides to sample the records to determine if absenteeism is distributed evenly throughout the six-day workweek. The null hypothesis to be tested is: Absenteeism is distributed evenly throughout the week. The 0.01 level is to be used. The sample results are: 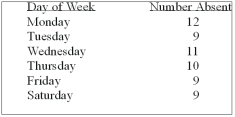 What is the expected frequency?
(Multiple Choice)
4.8/5 (42)
When determining how well an observed set of frequencies fit an expected set of frequencies the test is the:
(Multiple Choice)
5.0/5 (38)
At a recent automobile show, a sample of 135 people produced the following results. Use the 0.01 significance level to determine if there is a relationship between age and model preferred. 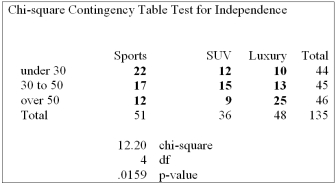 Based on the analysis above, what can be concluded?
(Multiple Choice)
4.8/5 (30)
Six people have declared their intentions to run for a trustee seat in the next local election. A political poll is conducted during the campaign among 1,020 voters to determine if there is any clear preference among the voters. The responses are shown below.  How many degrees of freedom are there?
(Multiple Choice)
4.9/5 (32)
i. chi-square test statistic used in a goodness-of-fit test has k - 1 degrees of freedom.T2 ii. The chi-square goodness-of-fit test can be applied if there are equal or unequal expected frequencies.T2
Iii) For a goodness-of-fit test, the number of degrees of freedom is determined by k - 2, where k is the number of categories.
(Multiple Choice)
4.7/5 (36)
i. For a goodness-of-fit test, the number of degrees of freedom is determined by k - 2, where k is the number of categories.
Ii) The sum of the expected frequencies in a goodness-of-fit test need not equal the sum of the observed frequencies.
Iii) A goodness-of-fit test is a nonparametric test involving a set of observed frequencies and a corresponding set of expected frequencies.
(Multiple Choice)
4.9/5 (39)
i. Nonparametric tests require no assumptions about the shape of the population distribution.
ii. Tests of hypotheses for nominal or ordinal levels of measurement are called nonparametric or distribution-free tests.
Iii) There is not one, but a family of chi-square distributions. There is a chi-square distribution for 1 degree of freedom, another for 2 degrees of freedom, another for 3 degrees of freedom, and so on.
(Multiple Choice)
4.8/5 (27)
A student asked a statistics professor if grades were marked "on the curve." The professor decided to give the student a project to determine if last year's statistics grades were normally distributed. The professor told the student that last year's mean mark was 70 with a standard deviation of 10 and to use the following results.  What is the expected number of A's?
(Multiple Choice)
4.9/5 (42)
Filters
- Essay(0)
- Multiple Choice(0)
- Short Answer(0)
- True False(0)
- Matching(0)