Exam 2: Describing Data: Frequency Distributions and Graphic Presentation
Exam 1: What Is Statistics78 Questions
Exam 2: Describing Data: Frequency Distributions and Graphic Presentation101 Questions
Exam 3: Describing Data: Numerical Measures186 Questions
Exam 4: A Survey of Probability Concepts121 Questions
Exam 5: Discrete Probability Distributions111 Questions
Exam 6: The Normal Probability Distribution129 Questions
Exam 7: Sampling Methods and the Central Limit Theorem78 Questions
Exam 8: Estimation and Confidence Intervals128 Questions
Exam 9: One-Sample Tests of a Hypothesis223 Questions
Exam 10: Two-Sample Tests of Hypothesis87 Questions
Exam 11: Analysis of Variance80 Questions
Exam 12: Linear Regression and Correlation150 Questions
Exam 13: Multiple Regression and Correlation Analysis98 Questions
Exam 14: Chi-Square Applications for Nominal Data113 Questions
Exam 15: Index Numbers65 Questions
Exam 16: Time Series and Forecasting86 Questions
Exam 17: An Introduction to Decision Theory37 Questions
Select questions type
The following class intervals for a frequency distribution were developed to provide information regarding the starting salaries for students graduating from a particular school: 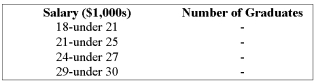 Before data was collected, someone questioned the validity of this arrangement. Which of the following represents a problem with this set of intervals?
Free
(Multiple Choice)
4.8/5  (34)
(34)
Correct Answer: Verified
D
What is the relative class frequency for the $25 up to $35 class? 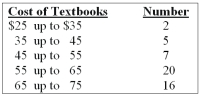
Free
(Multiple Choice)
4.9/5 (35)
Correct Answer:Verified
B
Refer to the following distribution of commissions: 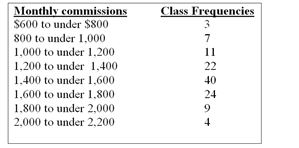 -What are the class limits for the class with the smallest number of frequencies?
Free
(Multiple Choice)
4.8/5 (34)
Correct Answer:Verified
C
When classes in a frequency table are constructed so that data will fit into only one category, it is called__________ .
(Short Answer)
4.7/5 (30)
The head of the statistics department wants to determine the number of mistake made by students in their first online assignment. She gathers information from her classes of the past year. 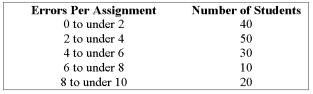 The approximate range of the data is______ .
(Multiple Choice)
4.7/5 (29)
Monthly commissions of first-year insurance brokers are $1,270, $1,310, $1,680, $1,380, $1,410, $1,570, $1,180 and $1,420. These figures are referred to as:
(Multiple Choice)
5.0/5 (42)
A student was interested in the cigarette smoking habits of college students and collected data from an unbiased random sample of students. The data is summarized in the following table: 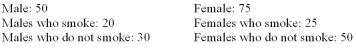 Why is the table NOT a frequency table?
(Multiple Choice)
4.8/5 (30)
Two advantages of a stem-and-leaf chart over a histogram are that the is not lost, and that it presents ______________.
(Essay)
4.8/5 (44)
(i) A frequency table is a grouping of qualitative data into mutually exclusive classes showing the number of observations in each class.
(ii) Simple bar charts may be constructed either horizontally or vertically. (iii) A bar chart is a graphic representation of a frequency table.
(Multiple Choice)
4.9/5 (42)
(i) Bar charts are useful for showing the percent that various components compose of the total. (ii) Simple bar charts may be constructed either horizontally or vertically. (iii) A bar chart is a graphic representation of a frequency table.
(Multiple Choice)
4.8/5 (33)
Refer to the following ages (rounded to the nearest whole year) of employees at a large company that were grouped into a distribution with class limits:
20 up to 30
30 up to 40
40 up to 50
50 up to 60
60 up to 70.
-IQs were tested for a number of students. The first three IQs are 105, 115, and 125.
The lower limit for the third class is_______ .
(Short Answer)
5.0/5 (36)
Refer to the following ages (rounded to the nearest whole year) of employees at a large company that were grouped into a distribution with class limits:
20 up to 30
30 up to 40
40 up to 50
50 up to 60
60 up to 70.
-IQs were tested for a number of students. The first three IQs are 105, 115, and 125.
The true class limits for the fourth class are_____ and__________ .
(Short Answer)
4.9/5 (38)
The grades on a statistics exam for a sample of students are as follows: 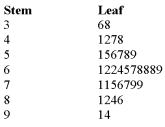 How many students wrote this test?
(Multiple Choice)
4.9/5 (37)
When data is collected using a qualitative, nominal variable, i.e., male or female, what is true about a frequency distribution that summarizes the data?
(Multiple Choice)
4.8/5 (34)
Using the frequency table below, determine the relative frequencies for Apartment and Townhouse listings. 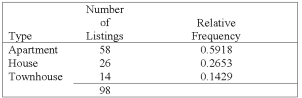
(Multiple Choice)
4.9/5 (36)
Refer to the following cumulative frequency distribution on days absent during a calendar year by employees of a manufacturing company: 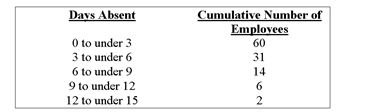 -How many employees were absent between 3 to under 6 days?
(Multiple Choice)
4.8/5 (26)
A table showing the number of observations that have been grouped into each of several classes is called a(n)___________ .
(Short Answer)
4.9/5 (35)
Refer to the following chart showing a distribution of exporting firms: 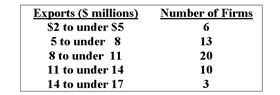 -How many firms export less than $14 million in product?
(Multiple Choice)
4.9/5 (40)
(i) Pie charts are useful for showing the percent that various components compose of the total. (ii) Simple bar charts may be constructed either horizontally or vertically. (iii) A bar chart is a graphic representation of a frequency table.
(Multiple Choice)
4.8/5 (33)
Filters
- Essay(0)
- Multiple Choice(0)
- Short Answer(0)
- True False(0)
- Matching(0)