Exam 3: Describing Data: Numerical Measures
Exam 1: What Is Statistics78 Questions
Exam 2: Describing Data: Frequency Distributions and Graphic Presentation101 Questions
Exam 3: Describing Data: Numerical Measures186 Questions
Exam 4: A Survey of Probability Concepts121 Questions
Exam 5: Discrete Probability Distributions111 Questions
Exam 6: The Normal Probability Distribution129 Questions
Exam 7: Sampling Methods and the Central Limit Theorem78 Questions
Exam 8: Estimation and Confidence Intervals128 Questions
Exam 9: One-Sample Tests of a Hypothesis223 Questions
Exam 10: Two-Sample Tests of Hypothesis87 Questions
Exam 11: Analysis of Variance80 Questions
Exam 12: Linear Regression and Correlation150 Questions
Exam 13: Multiple Regression and Correlation Analysis98 Questions
Exam 14: Chi-Square Applications for Nominal Data113 Questions
Exam 15: Index Numbers65 Questions
Exam 16: Time Series and Forecasting86 Questions
Exam 17: An Introduction to Decision Theory37 Questions
Select questions type
Three persons earn $8 an hour, six earn $9 an hour, and one earns $12 an hour. Find the weighted mean hourly wage.
Free
(Multiple Choice)
4.8/5  (43)
(43)
Correct Answer: Verified
B
A stockbroker placed the following order for a customer: -50 shares of Kaiser Aluminum preferred at $104 a share
-100 shares of GTE preferred at $25 1/4 a share
-20 shares of Boston Edison preferred at $9 1/8 a share
What is the weighted arithmetic mean price per share?
Free
(Multiple Choice)
4.8/5 (37)
Correct Answer:Verified
E
What is the size of the sample?
Free
(Multiple Choice)
4.8/5 (32)
Correct Answer:Verified
A
Fifteen accounting majors had an average grade of 90 on a finance exam. Seven marketing majors averaged 85, while ten finance majors averaged 93 on the same exam. What is the weighted mean for the 32 students taking the exam?
(Multiple Choice)
4.8/5 (43)
The coefficient of variation generally lies between what two values?
(Multiple Choice)
4.9/5 (37)
Listed below is the average earnings ratio by sex for full-year, full-time workers from 1999 to 2008. (Source: Adapted from Statistics Canada-see Connect for data file.) 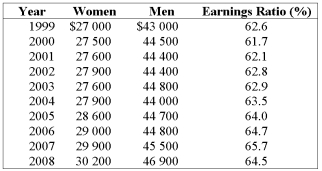 What are the median earnings for women for the years 1999-2008?
(Multiple Choice)
4.8/5 (34)
A telemarketing firm is monitoring the performance of its employees based on the number of sales per hour. One employee had the following sales for the last 20 hours
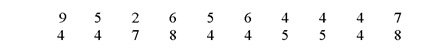 -The third quartile for the distribution of number of sales per hour is______ .
(Short Answer)
4.8/5 (27)
Listed below is the box plot of average earnings ratio for full-year, full-time female workers from 1999 to 2008: 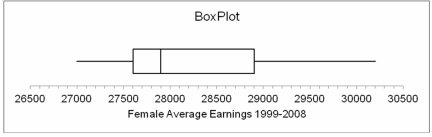 From this we can interpret that the first quartile of average earnings for women for the years 1999-
2008 was approximately:
From this we can interpret that the first quartile of average earnings for women for the years 1999-
2008 was approximately:
(Multiple Choice)
4.9/5 (40)
The sum of the differences between sample observations and the sample mean is
(Multiple Choice)
4.9/5 (29)
If a major sports star were to move into your neighbourhood, what would you expect to happen to the neighbourhood's "average" income?
(Multiple Choice)
4.8/5 (40)
If two sets of data are in different units, we can compare the dispersion by using___________.
(Short Answer)
4.9/5 (35)
The number of work stoppages in a highly industrialized region for selected months are: 6, 0, 10, 14, 8 and 0. What is the median number of stoppages?
(Multiple Choice)
4.8/5 (39)
A small manufacturing company with 52 employees has annual salaries distributed such that the mean is $25,459, the median is $24,798 and the mode is $24,000. An additional foreman is hired at an annual salary of $50,700. The measure of central tendency that is most affected by the addition of this salary is the _____________.
(Short Answer)
4.7/5 (41)
The value that occurs most often in a set of data is called the________
(Short Answer)
4.9/5 (31)
If a set of observations contains an extreme value and none of the observations repeat themselves, the ________is the most representative measure of central tendency.
(Short Answer)
5.0/5 (39)
Based on the graph below, how can we best describe the shape of this distribution? 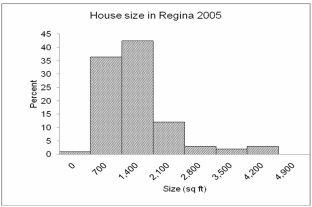
(Multiple Choice)
4.8/5 (33)
Samples of the wires coming off the production line were tested for tensile strength. The statistical results (in PSI) were: 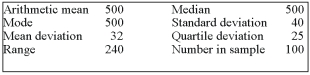 According to the Empirical Rule, the middle 95 percent of the wires tested between approximately what two values?
(Multiple Choice)
4.9/5 (43)
The ages of a sample of the typewriters used by the typists in the typing pool were organized into the following table: 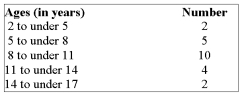 What is the sample variance?
(Multiple Choice)
4.8/5 (36)
Filters
- Essay(0)
- Multiple Choice(0)
- Short Answer(0)
- True False(0)
- Matching(0)