Exam 12: Linear Regression and Correlation
Exam 1: What Is Statistics78 Questions
Exam 2: Describing Data: Frequency Distributions and Graphic Presentation101 Questions
Exam 3: Describing Data: Numerical Measures186 Questions
Exam 4: A Survey of Probability Concepts121 Questions
Exam 5: Discrete Probability Distributions111 Questions
Exam 6: The Normal Probability Distribution129 Questions
Exam 7: Sampling Methods and the Central Limit Theorem78 Questions
Exam 8: Estimation and Confidence Intervals128 Questions
Exam 9: One-Sample Tests of a Hypothesis223 Questions
Exam 10: Two-Sample Tests of Hypothesis87 Questions
Exam 11: Analysis of Variance80 Questions
Exam 12: Linear Regression and Correlation150 Questions
Exam 13: Multiple Regression and Correlation Analysis98 Questions
Exam 14: Chi-Square Applications for Nominal Data113 Questions
Exam 15: Index Numbers65 Questions
Exam 16: Time Series and Forecasting86 Questions
Exam 17: An Introduction to Decision Theory37 Questions
Select questions type
Information was collected from employee records to determine whether there is an association between an employee's age and the number or workdays they miss. Excel results are summarized below:  From this printout you determine:
Free
(Multiple Choice)
4.9/5  (38)
(38)
Correct Answer: Verified
E
i. The purpose of correlation analysis is to find how strong the relationship is between two variables.
ii. A correlation coefficient of -1 or +1 indicates perfect correlation.
Iii) The standard error of estimate measures the accuracy of our prediction.
Free
(Multiple Choice)
4.7/5 (33)
Correct Answer:Verified
A
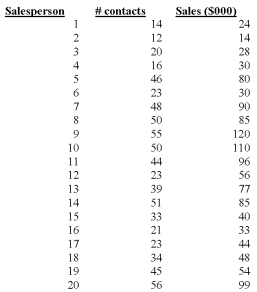
Data is collected from 20 sales people in order to verify that the more contacts made with potential clients, the greater the sales volume. The MegaStat printout is shown below. (or use the excel file #contacts and sales n = 20 data only) 
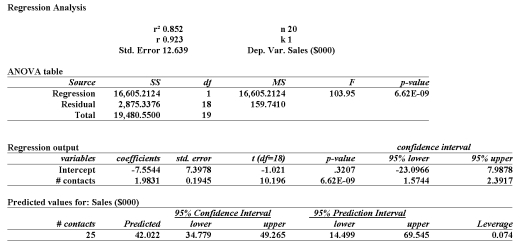 Determine the 95% prediction interval for Sales when 25 contacts are made
Free
(Multiple Choice)
4.8/5 (47)
Correct Answer:Verified
A
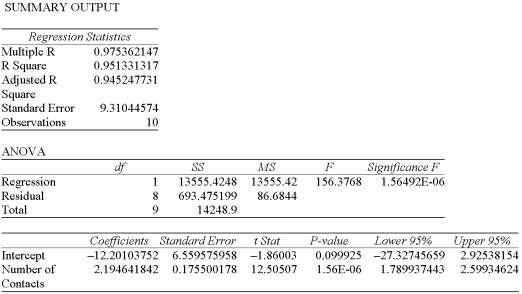
Data is collected from 20 sales people in order to verify that the more contacts made with potential clients, the greater the sales volume. The Excel printout is shown below. 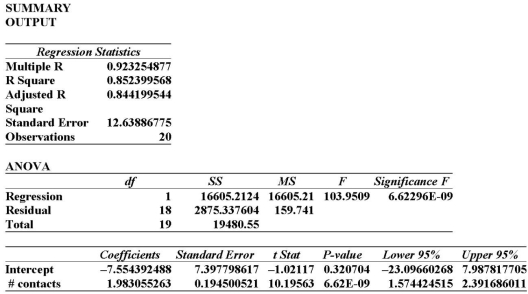 The y-intercept in this instance suggests:
(Multiple Choice)
4.7/5 (38)
Information was collected from employee records to determine whether there is an association between an employee's age and the number or workdays they miss. Excel results are summarized below: 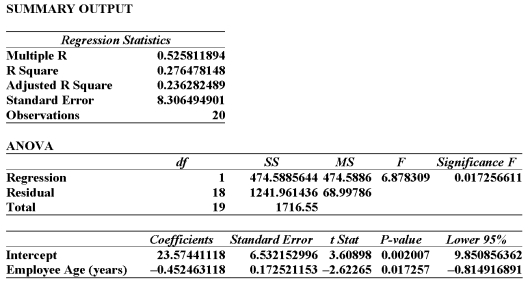 From this printout you determine:
(Multiple Choice)
4.8/5 (31)
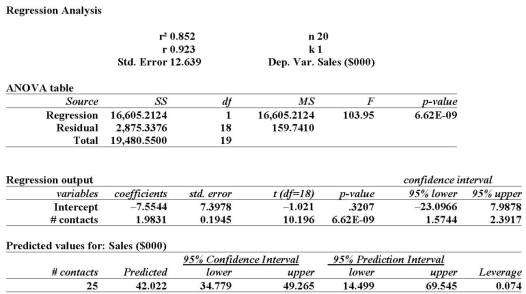 Determine the 95% confidence interval for Sales when 25 contacts are made.
(Multiple Choice)
4.9/5 (31)
Which value of r indicates a stronger correlation than -0.40?
(Multiple Choice)
4.8/5 (38)
Use the scatter diagrams to verify which statements are correct:
Chart A 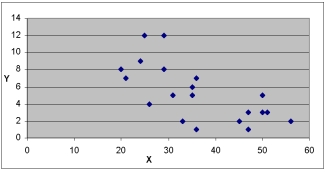 Chart B
 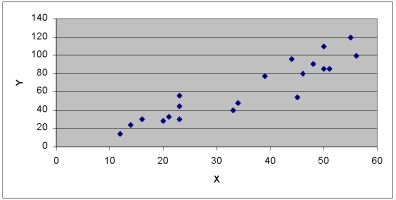 Chart C
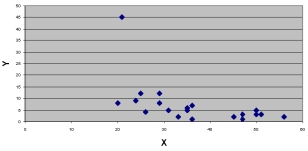
(Multiple Choice)
4.9/5 (39)
i. A coefficient of correlation r close to 0 (say, 0.08) shows that the relationship between two variables is quite weak.
ii. If the coefficient of correlation is 0.68, the coefficient of determination is 0.4624.
iii. The standard error of estimate measures the accuracy of our prediction.
(Multiple Choice)
4.8/5 (33)
A sales manager for an advertising agency believes there is a relationship between the number of contacts and the amount of the sales. To verify this belief, the following data was collected: 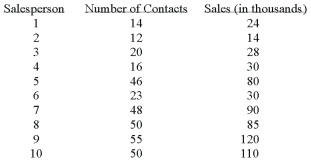
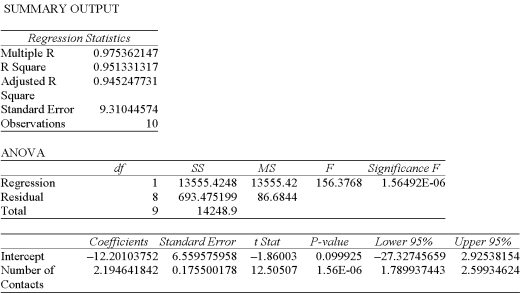 What is the regression equation?
(Multiple Choice)
4.8/5 (41)
i. A coefficient of correlation r close to 0 (say, 0.08) shows that the relationship between two variables is quite weak.
ii. Coefficients of -0.91 and +0.91 have equal strength.
Iii) If the coefficient of correlation is 0.68, the coefficient of determination is 0.4624.
(Multiple Choice)
4.8/5 (36)
i. The basic question in testing the significance of rho is to see if there is zero correlation in the population from which the sample was selected.
Ii) A t test is used to test the significance of the coefficient of correlation.
Iii) Suppose a sample of 15 homes recently sold in your area is obtained. The correlation between the area of the home, in square feet, and the selling price is 0.40. We want to test the hypothesis that the correlation in the population is zero versus the alternate that it is greater than zero. You determine that the rejection region should fall in the lower tail if this is a one-tailed test and we use a 0.01 significance level.
(Multiple Choice)
4.8/5 (35)
i. The strength of the correlation between two variables depends on the sign of the coefficient of correlation.
Ii) A coefficient of correlation r close to 0 (say, 0.08) shows that the relationship between two variables is quite weak.
Iii) Coefficients of -0.91 and +0.91 have equal strength.
(Multiple Choice)
4.7/5 (30)
What does the coefficient of determination equal if r = 0.89?
(Multiple Choice)
4.9/5 (43)
i. A coefficient of correlation r close to 0 (say, 0.08) shows that the relationship between two variables is quite weak.
Ii) The coefficient of determination is the proportion of the total variation in the dependent variable Y
That is explained or accounted for by its relationship with the independent variable X.
iii. If the coefficient of correlation is -0.90, the coefficient of determination is -0.81.
(Multiple Choice)
4.7/5 (43)
i. The basic question in testing the significance of rho is to see if there is zero correlation in the population from which the sample was selected.
Ii) A t test is used to test the significance of the coefficient of correlation.
Iii) When testing the strength of the relationship between two variables, the alternate hypothesis is: H0: ? ? 0.T4
(Multiple Choice)
4.7/5 (34)
A sales manager for an advertising agency believes there is a relationship between the number of contacts and the amount of the sales. To verify this belief, the following data was collected: 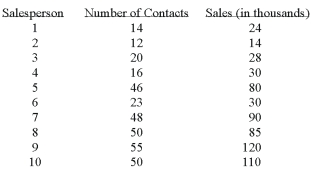
 This model predicts that with 25 sales contacts, sales will be:
(Multiple Choice)
4.7/5 (43)
Data is collected from 20 sales people in order to verify that the more contacts made with potential clients, the greater the sales volume. A scatter diagram of the collected information is shown below. 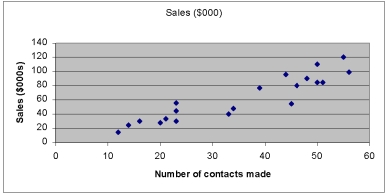 Looking at this scatter diagram you determine:
(Multiple Choice)
4.9/5 (31)
Filters
- Essay(0)
- Multiple Choice(0)
- Short Answer(0)
- True False(0)
- Matching(0)