Exam 3: Describing Data: Numerical Measures
Exam 1: What Is Statistics78 Questions
Exam 2: Describing Data: Frequency Distributions and Graphic Presentation101 Questions
Exam 3: Describing Data: Numerical Measures186 Questions
Exam 4: A Survey of Probability Concepts121 Questions
Exam 5: Discrete Probability Distributions111 Questions
Exam 6: The Normal Probability Distribution129 Questions
Exam 7: Sampling Methods and the Central Limit Theorem78 Questions
Exam 8: Estimation and Confidence Intervals128 Questions
Exam 9: One-Sample Tests of a Hypothesis223 Questions
Exam 10: Two-Sample Tests of Hypothesis87 Questions
Exam 11: Analysis of Variance80 Questions
Exam 12: Linear Regression and Correlation150 Questions
Exam 13: Multiple Regression and Correlation Analysis98 Questions
Exam 14: Chi-Square Applications for Nominal Data113 Questions
Exam 15: Index Numbers65 Questions
Exam 16: Time Series and Forecasting86 Questions
Exam 17: An Introduction to Decision Theory37 Questions
Select questions type
A study of business faculty in Ontario revealed that the arithmetic mean annual salary is $62,000 and a standard deviation of $3,000. The study also showed that the faculty had been employed an average (arithmetic mean) of 15 years with a standard deviation of 4 years. How does the relative dispersion in the distribution of salaries compare with that of the lengths of service?
(Multiple Choice)
4.9/5  (34)
(34)
A sample of the daily number of passengers per bus riding the Bee Line commuter route yielded the following information: 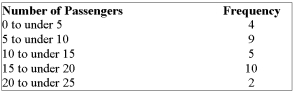 What is the standard deviation?
(Multiple Choice)
4.8/5 (38)
A study of business faculty in Ontario revealed that the arithmetic mean annual salary is $72,000 and a standard deviation of $3,000. The study also showed that the faculty had been employed an average (arithmetic mean) of 15 years with a standard deviation of 4 years. How does the relative dispersion in the distribution of salaries compare with that of the lengths of service?
(Multiple Choice)
4.8/5 (32)
If the mean of a frequency distribution is smaller than the median and mode, the Pearson's coefficient of skewness would be ___________.
(Short Answer)
4.8/5 (32)
Listed below is the average earnings ratio by sex for full-year, full-time workers from 1999 to 2008. (Source: Adapted from Statistics Canada-see Connect for data file.) 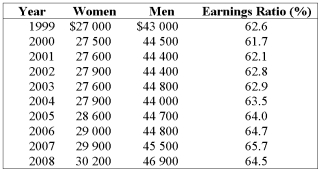 What were the mean earnings for men for the years 1999-2008?
(Multiple Choice)
4.9/5 (32)
If the sum of all the values of a distribution is divided by the number of values, the result is the_________
(Short Answer)
4.7/5 (33)
The printout below is a summary of the average annual earnings of male full time workers in Canada from 1999-2008. Determine the coefficient of variation. 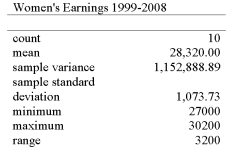
(Multiple Choice)
4.7/5 (41)
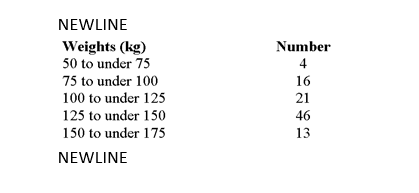
The weights of a sample of 100 boxes being shipped by Air France from Toronto to Paris are:
 -The standard deviation for polyester carpet is____________ .
(Short Answer)
4.7/5 (35)
For which measure of central tendency will the sum of the deviations of each value from that average always be zero?
(Multiple Choice)
5.0/5 (39)
Using the information gathered for real estate prices in Regina and surrounding areas in the early 2000's, determine the mean of the selling prices at that time. 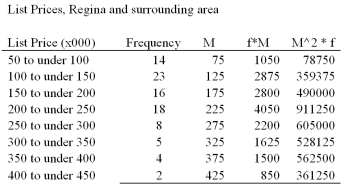
(Multiple Choice)
4.9/5 (37)
In the relationship between the mean and median in a negatively skewed distribution the is less than the ___________.
(Short Answer)
4.8/5 (40)
The measure of central tendency used to determine the average annual percent increase in sales from one time period to another is the_______ .
(Short Answer)
4.8/5 (38)
A survey of passengers on domestic flights revealed these distances: 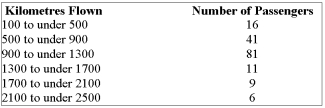 What is the range (in kms)?
(Multiple Choice)
4.8/5 (39)
i. The interquartile range is the difference between the values of the first and third quartile, indicating the range of the middle fifty percent of the observations.
Ii) An outlier is a data point that always occurs in the first quartile.
Iii) A student scored in the 85 percentile on a standardized test. This means that the student scored higher than 85% of the rest of the students taking the test.
(Multiple Choice)
4.7/5 (39)
The weights of a sample of 100 boxes being shipped by Air France from Toronto to Paris are:
-The range for polyester carpet is _______-.
(Short Answer)
4.9/5 (44)
Listed below is the box plot of average earnings ratio for full-year, full-time female workers from 1999 to 2008: 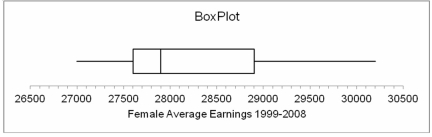 From this we can interpret that the range of average earnings for women for the years 1999-2008 was approximately:
(Multiple Choice)
4.7/5 (45)
Referring to the printout below, describe the shape of the distribution of the corresponding histogram. 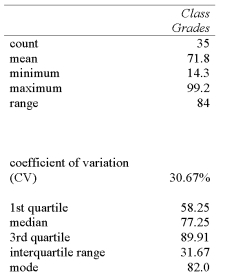
(Multiple Choice)
4.9/5 (41)
The weights (in grams) of the contents of several small bottles are 4, 2, 5, 4, 5, 2 and 6. What is the sample variance?
(Multiple Choice)
4.9/5 (35)
The ______is the class with the largest number of observations.
(Short Answer)
4.8/5 (39)
i. A parameter is a measurable characteristic of a sample.
ii. The weighted mean is the nth root of n observations.
iii. A statistic is a measurable characteristic of the population.
(Multiple Choice)
4.8/5 (42)
Filters
- Essay(0)
- Multiple Choice(0)
- Short Answer(0)
- True False(0)
- Matching(0)