Exam 3: Numerically Summarizing Data
Exam 1: Data Collection113 Questions
Exam 2: Organizing and Summarizing Data82 Questions
Exam 3: Numerically Summarizing Data141 Questions
Exam 4: Describing the Relation Between Two Variables72 Questions
Exam 5: Probability257 Questions
Exam 6: Discrete Probability Distributions131 Questions
Exam 7: The Normal Probability Distribution120 Questions
Exam 8: Sampling Distributions52 Questions
Exam 9: Estimating the Value of a Parameter88 Questions
Exam 10: Hypothesis Tests Regarding a Parameter140 Questions
Exam 11: Inferences on Two Samples129 Questions
Exam 12: Inference on Categorical Data38 Questions
Exam 13: Comparing Three or More Means51 Questions
Select questions type
A severe drought affected several western states for 3 years. A Christmas tree farmer is worried about thedroughtʹs effect on the size of his trees. To decide whether the growth of the trees has been retarded, the farmerdecides to take a sample of the heights of 25 trees and obtains the following results (recorded in inches): 60 57 62 69 46 54 64 60 59 58 75 51 49 67 65 44 58 55 48 62 63 73 52 55 50 Which measure of central tendency would be considered the best measure to use in this problem?
(Multiple Choice)
4.7/5  (39)
(39)
Many firms use on-the-job training to teach their employees new software. Suppose you work in the personneldepartment of a firm that just finished training a group of its employees in new software, and you have beenrequested to review the performance of one of the trainees on the final test that was given to all trainees. Themean of the test scores is 76. Additional information indicated that the median of the test scores was 83. Whattype of distribution most likely describes the shape of the test scores?
(Multiple Choice)
4.9/5 (38)
To study the physical fitness of a sample of 28 people, the data below were collected representing the numberof sit-ups that a person could do in one minute. 10 12 12 15 15 15 18 20 22 25 25 26 29 30 32 33 40 40 40 45 46 47 48 48 50 52 53 56 Determine the lower and upper fences. Are there any outliers according to this criterion?
(Essay)
5.0/5 (25)
The commuting times (in minutes) of an employee for ten consecutive days are listed below. Find the mediancommute.71 67 67 72 76 72 73 68 72 72
(Multiple Choice)
4.7/5 (46)
If nothing is known about the shape of a distribution, what percentage of the observations fall within 2standard deviations of the mean?
(Multiple Choice)
4.9/5 (42)
Describe the shape of the histogram. The data set: age of 20 household stereo systems randomly selectedfrom a neighborhood 12 6 4 9 11 1 7 8 9 8 9 13 5 15 7 6 8 8 2 1
(Multiple Choice)
4.9/5 (34)
The February utility bills (in dollars) for ten residents of a large city are listed below. Find the mode amount.71 67 67 72 76 72 73 68 72 72
(Multiple Choice)
4.9/5 (36)
Fill in the blank. ____________ is a method of interpreting the standard deviation that applies to data that havea bell-shaped distribution.
(Multiple Choice)
4.8/5 (34)
Each year advertisers spend billions of dollars purchasing commercial time on network sports television. In thefirst 6 months of 1988, advertisers spent $1.1 billion. A recent article listed the top 10 leading spenders (inmillions of dollars): Company A \ 70.3 Company F \ 26.4 Company B 60.5 Company G 24.6 Company C 57.9 Company H 21.1 Company D 54.7 Company I 22.4 Company E 29.3 Company J 20.9 Calculate the mean amount spent.
(Multiple Choice)
4.9/5 (38)
A group of 79 students were asked how far they commute to work from home each time they go to work fromhome. The results are given below. Determine the first quartile. Miles traveled Frequency 1 1 2 2 3 12 4 18 5 7 6 10 7 10 8 11 9 5 10 3
(Multiple Choice)
4.9/5 (34)
If the graph of a distribution of data shows that the graph is skewed to the left then the
(Multiple Choice)
4.7/5 (39)
The book cost (in dollars) for one semesterʹs books are given below for a sample of five college students.Calculate the sample variance of the book costs.200, 130, 400, 500, 345
(Multiple Choice)
4.9/5 (37)
A television station claims that the amount of advertising per hour of broadcast time has an average of 16minutes and a standard deviation equal to 1.4 minutes. You watch the station for 1 hour, at a randomlyselected time, and carefully observe that the amount of advertising time is equal to 8 minutes. Calculate thez-score for this amount of advertising time.
(Multiple Choice)
5.0/5 (34)
If the graph of a distribution of data shows that the graph is symmetric then the
(Multiple Choice)
4.8/5 (29)
On a recent day during the flu season, the Midtown Medical Clinic saw many patients. Patients had theirtemperatures taken (in °F). The distribution of temperatures is given below. Determine the standard deviationof the temperatures of a sample of 100 patients. Temperatures Frequency 95.6-96.49 1 96.5-97.39 3 97.4-98.29 19 98.3-99.19 28 99.2-100.09 35 100.1-100.99 12 101.0-101.89 2
(Multiple Choice)
4.7/5 (23)
A study was designed to investigate the effects of two variables - (1) a studentʹs level of mathematical anxietyand (2) teaching method - on a studentʹs achievement in a mathematics course. Students who had a low levelof mathematical anxiety were taught using the traditional expository method. These students obtained a meanscore of 360 and a standard deviation of 50 on a standardized test. Find and interpret the z-score of a studentwho scored 380 on the standardized test.
(Essay)
4.8/5 (32)
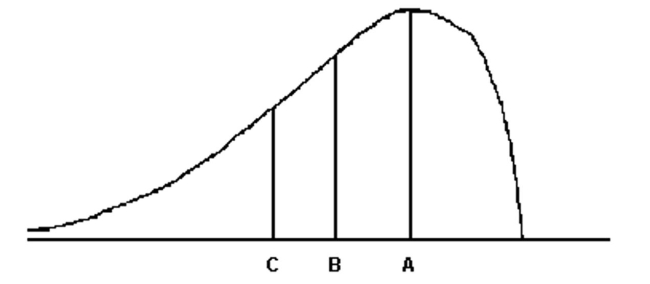 For the distribution drawn here, identify the mean, median, and mode.
(Multiple Choice)
4.8/5 (27)
At a tennis tournament a statistician keeps track of every serve. The statistician reported that the mean servespeed of a particular player was 104 miles per hour (mph) and the standard deviation of the serve speeds was 8mph. Assume that the statistician also gave us the information that the distribution of the serve speeds was bellshaped. What proportion of the playerʹs serves are expected to be between 112 mph and 120 mph?
(Multiple Choice)
4.8/5 (39)
Filters
- Essay(0)
- Multiple Choice(0)
- Short Answer(0)
- True False(0)
- Matching(0)