Exam 3: Numerically Summarizing Data
Exam 1: Data Collection113 Questions
Exam 2: Organizing and Summarizing Data82 Questions
Exam 3: Numerically Summarizing Data141 Questions
Exam 4: Describing the Relation Between Two Variables72 Questions
Exam 5: Probability257 Questions
Exam 6: Discrete Probability Distributions131 Questions
Exam 7: The Normal Probability Distribution120 Questions
Exam 8: Sampling Distributions52 Questions
Exam 9: Estimating the Value of a Parameter88 Questions
Exam 10: Hypothesis Tests Regarding a Parameter140 Questions
Exam 11: Inferences on Two Samples129 Questions
Exam 12: Inference on Categorical Data38 Questions
Exam 13: Comparing Three or More Means51 Questions
Select questions type
Health care issues are receiving much attention in both academic and political arenas. A sociologist recentlyconducted a survey of senior citizens whose net worth is too high to qualify for government health care butwho have no private health insurance. The ages of 25 uninsured senior citizens were as follows: 71 76 69 79 89 77
64 92 68 93 72 95
79 65 84 66 71 84
73 76 63 90 78 67 85 Find Q1 of the data.
(Multiple Choice)
4.8/5  (30)
(30)
For the data set given below the sample variance will be computed. How many degrees of freedom are there?6 9 6 1 5 11 5 9 8
(Multiple Choice)
4.8/5 (30)
A random sample of sale prices of homes yielded the following summary information: MIN \ 41,000 25\%:\ 82,000 Median: \ 124,000 MAX \ 276,000 75\%:\ 169,000 Comment on a home that had a sale price of $429,000.
(Multiple Choice)
4.7/5 (29)
The following data represents a random sample of 15 complaints registered with the customer servicedepartment of a store. Determine the median complaint. Other defective product excessive waiting time Messy store other other Messy store other messy store Other messy store messy store Defective product other messy store
(Multiple Choice)
4.8/5 (32)
Given the following five-number summary, find the IQR.2.9, 5.7, 10.0, 13.2, 21.1.
(Multiple Choice)
4.8/5 (36)
At a tennis tournament a statistician keeps track of every serve. The statistician reported that the mean servespeed of a particular player was 98 miles per hour (mph) and the standard deviation of the serve speeds was 14mph. If nothing is known about the shape of the distribution, give an interval that will contain the speeds of atleast eight-ninths of the playerʹs serves.
(Multiple Choice)
4.9/5 (32)
SAS was used to compare the high school dropout rates for the 30 school districts in one city in 2010 and 2012.The box plots generated for these dropout rates are shown below.Compare the center of the distributions and the variation of the distributions for the two years. 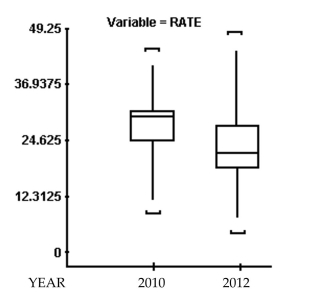
(Multiple Choice)
4.8/5 (33)
A small computing center has found that the number of jobs submitted per day to its computers has adistribution that is approximately bell shaped, with a mean of 84 jobs and a standard deviation of 10. Where dowe expect most (approximately 95%) of the distribution to fall?
(Multiple Choice)
4.7/5 (40)
The percentage of measurements that are above the 39th percentile is
(Multiple Choice)
4.9/5 (37)
A highly selective boarding school will only admit students who place at least 1.5 z-scores above the mean on astandardized test that has a mean of 110 and a standard deviation of 12. What is the minimum score that anapplicant must make on the test to be accepted?
(Multiple Choice)
4.8/5 (43)
A severe drought affected several western states for 3 years. A Christmas tree farmer is worried about thedroughtʹs effect on the size of his trees. To decide whether the growth of the trees has been retarded, the farmerdecides to take a sample of the heights of 25 trees. Typically trees of this age have a mean height of 65 incheswith a standard deviation of 9 inches. Assuming the distribution is bell shaped, where do you expect middle95% of the tree heights to fall?
(Multiple Choice)
4.8/5 (39)
The cholesterol levels (in milligrams per deciliter) of 30 adults are listed below. Draw a boxplot that representsthe data. 154 156 165 165 170 171 172 180 184 185 189 189 190 192 195 198 198 200 200 200 205 205 211 215 220 220 225 238 255 275
(Essay)
4.9/5 (32)
The boxplot shown below was constructed in Excel for the amount of soda that was poured by a fillingmachine into 12-ounce soda cans at a local bottling company. 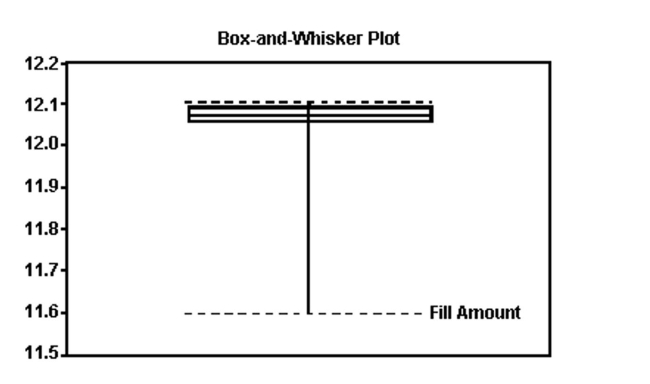 Based on the information given in the boxplot below, what shape do you believe the data to have?
(Multiple Choice)
4.8/5 (37)
Each year advertisers spend billions of dollars purchasing commercial time on network sports television. In thefirst 6 months of 1988, advertisers spent $1.1 billion. Who were the largest spenders? In a recent article, listedthe top 10 leading spenders (in million of dollars): Company A \ 70.7 Company F \ 27.3 Company B 60.7 Company G 26.1 Company C 55.4 Company H 22.8 Company D 54.8 Company I 23 Company E 28.7 Company J 19.4 Calculate the sample variance.
(Multiple Choice)
4.8/5 (35)
Which measure of central tendency is not resistant to extreme values in a numeric data set?
(Multiple Choice)
4.8/5 (42)
A study was designed to investigate the effects of two variables - (1) a studentʹs level of mathematical anxietyand (2) teaching method - on a studentʹs achievement in a mathematics course. Students who had a low levelof mathematical anxiety were taught using the traditional expository method. These students obtained a meanscore of 460 with a standard deviation of 50 on a standardized test. Assuming a bell-shaped distribution, whatpercentage of scores exceeded 360?
(Multiple Choice)
4.8/5 (27)
The amount of television viewed by todayʹs youth is of primary concern to Parents Against WatchingTelevision (PAWT). 300 parents of elementary school-aged children were asked to estimate the number ofhours per week that their child watched television. The mean and the standard deviation for their responseswere 16 and 4, respectively. PAWT constructed a stem-and-leaf display for the data that showed that thedistribution of times was a bell-shaped distribution. Give an interval around the mean where you believe most(approximately 95%) of the television viewing times fell in the distribution.
(Multiple Choice)
4.8/5 (31)
The costs (in dollars) of 10 college math textbooks are listed below. Find the population standard deviationand the population variance.70 72 71 70 69 73 69 68 70 71
(Essay)
4.8/5 (27)
If the graph of a distribution of data shows that the graph is skewed to the right then the
(Multiple Choice)
4.8/5 (28)
Filters
- Essay(0)
- Multiple Choice(0)
- Short Answer(0)
- True False(0)
- Matching(0)