Exam 8: Inferences Based on Two Samples: Confidence Intervals and Tests of Hypotheses
Exam 1: Statistics, Data, and Statistical Thinking74 Questions
Exam 2: Methods for Describing Sets of Data188 Questions
Exam 3: Probability237 Questions
Exam 4: Random Variables and Probability Distributions273 Questions
Exam 5: Sampling Distributions52 Questions
Exam 6: Inferences Based on a Single Sample: Estimation With Confidence Intervals135 Questions
Exam 7: Inferences Based on a Single Sample: 355 Tests of Hypotheses144 Questions
Exam 8: Inferences Based on Two Samples: Confidence Intervals and Tests of Hypotheses102 Questions
Exam 9: Design of Experiments and Analysis of Variance87 Questions
Exam 10: Categorical Data Analysis59 Questions
Exam 11: Simple Linear Regression113 Questions
Exam 12: Multiple Regression and Model Building131 Questions
Exam 13: Methods for Quality Improvement: Statistical Process Control Available on CD89 Questions
Exam 14: Time Series: Descriptive Analyses, Models, and Forecasting Available on CD73 Questions
Exam 15: Nonparametric Statistics Available on CD49 Questions
Select questions type
A marketing study was conducted to compare the mean age of male and female purchasers of a certain product. Random and independent samples were selected for both male and female purchasers of the product. It was desired to test to determine if the mean age of all female purchasers exceeds the mean age of all male purchasers. The sample data is shown here:
Female: sample mean sample standard deviation
Male: sample mean sample standard deviation
Use the pooled estimate of the population standard deviation to calculate the value of the test statistic to use in this test of hypothesis.
(Multiple Choice)
4.8/5  (34)
(34)
A paired difference experiment yielded pairs of observations. For the given case, what is the rejection region for testing against Ha: ?
(Multiple Choice)
4.8/5 (36)
University administrators are trying to decide where to build a new parking garage on campus. The state legislature has budgeted just enough money for one parking structure on campus. The administrators have determined that the parking garage will be built either by the college of engineering or by the college of business. To help make the final decision, the university has
Randomly and independently asked students from each of the two colleges to estimate how long they usually take to find a parking spot on campus (in minutes). Suppose that the sample sizes selected by the university for the two samples were both ne = nb= 15. What critical value should be used by the university in the calculations for the 95% confidence interval for µe - µb? Assume that the university used the pooled estimate of the population variances in the calculation of the
Confidence interval.
(Multiple Choice)
4.8/5 (45)
Independent random samples from normal populations produced the results shown below.
Sample 1: 5.8, 5.1, 3.9, 4.5, 5.4
Sample 2: 4.4, 6.1, 5.2, 5.7
a. Calculate the pooled estimator of .
b. Test using .
c. Find a confidence interval for .
(Essay)
4.9/5 (36)
A confidence interval for is . Which of the following inferences is correct?
(Multiple Choice)
4.8/5 (35)
The sample standard deviation of differences sd is equal to the difference of the sample standard deviations s1 - s2
(True/False)
4.8/5 (38)
The FDA is comparing the mean caffeine contents of two brands of cola. Independent random samples of 6-oz. cans of each brand were selected and the caffeine content of each can determined.
The study provided the following summary information. Brand A Brand B Sample size 15 10 Mean 18 20 Variance 1.2 1.5
How many cans of each soda would need to be sampled in order to estimate the difference in the mean caffeine content to within . 10 with reliability?
(Multiple Choice)
4.9/5 (35)
A researcher is investigating which of two newly developed automobile engine oils is better at prolonging the life of an engine. Since there are a variety of automobile engines, 20 different engine types were randomly selected and were tested using each of the two engine oils. The number of
Hours of continuous use before engine breakdown was recorded for each engine oil. Based on the information provided, what type of analysis will yield the most useful information?
(Multiple Choice)
4.8/5 (39)
Suppose it desired to compare two physical education training programs for preadolescent girls. A total of 122 girls are randomly selected, with 61 assigned to each program. After three 6-week periods on the program, each girl is given a fitness test that yields a score between 0 and 100. The means and variances of the scores for the two groups are shown in the table.
n Program 1 61 78.9 201.1 Program 2 61 75.5 259.8
Test to determine if the variances of the two programs differ. Use
(Essay)
4.8/5 (40)
The screen below shows the confidence interval for .
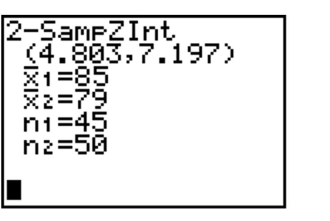 What does the interval suggest about the relationship between and ?
(Essay)
4.7/5 (34)
Suppose you want to estimate the difference between two population proportions correct to within with probability . If prior information suggests that and , and you want to select independent random samples of equal size from the populations, how large should the sample sizes be?
(Multiple Choice)
4.8/5 (45)
Calculate the degrees of freedom associated with a small-sample test of hypothesis for , assuming and .
(Multiple Choice)
4.7/5 (41)
Suppose you want to estimate the difference between two population means correct to within 2.5 with probability 0.95. If prior information suggests that the population variances are both equal to the value 20, and you want to select independent random samples of equal size from the populations, how large should the sample sizes be?
(Multiple Choice)
4.9/5 (34)
A certain manufacturer is interested in evaluating two alternative manufacturing plans consisting of different machine layouts. Because of union rules, hours of operation vary greatly for this particular manufacturer from one day to the next. Twenty-eight random working days were selected and each plan was monitored and the number of items produced each day was recorded. some of the collected data is shown below:
DAY PLAN 1 OUTPUT PLAN 2 OUTPUT 1 1234 units 1311 units 2 1355 units 1366 units 3 1300 units 1289 units What type of analysis will best allow the manufacturer to determine which plan is more effective?
(Multiple Choice)
4.9/5 (46)
The owners of an industrial plant want to determine which of two types of fuel (gas or electricity) will produce more useful energy at a lower cost. The cost is measured by plant investment per delivered quad ($ invested /quadrillion BTUs). The smaller this number, the less the industrial plant pays for delivered energy. Suppose we wish to determine if there is a difference in the average investment/quad between using electricity and using gas. Our null and alternative hypotheses would be:
(Multiple Choice)
4.7/5 (41)
A marketing study was conducted to compare the mean age of male and female purchasers of a certain product. Random and independent samples were selected for both male and female purchasers of the product. It was desired to test to determine if the mean age of all female purchasers exceeds the mean age of all male purchasers. The sample data is shown here:
Female: sample mean sample standard deviation
Male: sample mean sample standard deviation
Suppose the test statistic was calculated to be the value, . Use the rejection region to state the correct conclusion when testing at alpha .
(Multiple Choice)
4.9/5 (40)
In order to compare the means of two populations, independent random samples of 225 observations are selected from each population with the following results.
Sample 1 Sample 2 =478 =481 =14.2 =11.2
Test the null hypothesis against the alternative hypothesis using . Give the significance level, and interpret the result.
(Essay)
4.9/5 (46)
Data were collected from CEOs in the consumer products industry and CEOs in the telecommunication industry. The data were analyzed using a software package in order to compare mean salaries of CEOs in the two industries.
HYPOTHESIS: MEAN X = MEAN Y
SAMPLES SELECTED FROM SALARY
Consumer Products
Telecommunications
SAMPLE MEAN OF
SAMPLE VARIANCE OF E6
SAMPLE SIZE OF X
SAMPLE MEAN OF
SAMPLE VARIANCE OF
SAMPLE SIZE OF
MEAN X - MEAN Y
test statistic
D. F.
P-VALUE
SD. ERROR
Find the p-value for testing a two-tailed alternative hypothesis.
(Multiple Choice)
4.9/5 (32)
Independent random samples of 100 observations each are chosen from two normal populations with the following means and standard deviations. Population 1 Population 2 =15 =13 =3 =2 Find the mean and standard deviation of the sampling distribution of - .
(Essay)
4.9/5 (36)
Filters
- Essay(0)
- Multiple Choice(0)
- Short Answer(0)
- True False(0)
- Matching(0)