Exam 6: Correlation and Linear Regression
Exam 2: Data20 Questions
Exam 3: Surveys and Sampling26 Questions
Exam 4: Displaying and Describing Categorical Data21 Questions
Exam 5: Displaying and Describing Quantitative Data24 Questions
Exam 6: Correlation and Linear Regression36 Questions
Exam 7: Randomness and Probability28 Questions
Exam 8: Random Variables and Probability Models24 Questions
Exam 9: The Normal Distribution21 Questions
Exam 10: Confidence Intervals for Means20 Questions
Exam 11: Confidence Intervals for Proportions28 Questions
Exam 12: Confidence Intervals for Means21 Questions
Exam 13: Testing Hypotheses18 Questions
Exam 14: Comparing Two Groups19 Questions
Exam 15: Inference for Counts: Chi-Square20 Questions
Exam 16: Inference for Regression22 Questions
Exam 17: Understanding Residuals22 Questions
Exam 18: Multiple Regression15 Questions
Exam 19: Data13 Questions
Exam 22: Business Statistics20 Questions
Exam 24: Decision Making and Risk25 Questions
Exam 25: Introduction to Data Mining11 Questions
Exam 26: Exploring and Collecting Data43 Questions
Exam 27: Modeling With Probability20 Questions
Exam 28: Inference for Decision Making25 Questions
Exam 29: Models for Decision Making38 Questions
Exam 30: Selected Topics in Decision Making22 Questions
Select questions type
Interpret the value of correlation coefficients and squared correlations.
-Shown below is a correlation table showing correlation coefficients between stock
Price, earnings per share (EPS) and price / earnings (P / E) ratio for a sample of 19
Publicly traded companies. Which of the following statements is false?
Correlations: Stock Price, EPS, PE Stock Price EPS EPS 0.875 PE 0.323 -0.111
(Multiple Choice)
4.7/5  (26)
(26)
Write and interpret a linear regression equation.
-A small independent organic food store offers a variety of specialty coffees. To
Determine whether price has an impact on sales, the managers kept track of how many
Pounds of each variety of coffee were sold last month. Based on the data and summary
Statistics shown below, the intercept of the estimated regression line that relates the
Response variable (monthly sales) to the predictor variable (price per pound) is PRICE PER POUND POUNDS SOLD \ 3.99 75 \ 5.99 60 \ 7.00 65 \ 12.00 45 \ 4.50 80 \ 7.50 70 \ 15.00 25 \ 10.00 35 \ 12.50 40 \ 8.99 50 Mean \ 8.75 54.50 Standard Deviation \ 3.63 18.33 Correlation -
(Multiple Choice)
4.9/5 (38)
Interpret a linear regression equation and use it to make a prediction.
-Data were collected on monthly sales revenues (in $1,000s) and monthly advertising
Expenditures ($100s) for a sample of drug stores. The regression line relating revenues
(Y) to advertising expenditure (X) is estimated to be yˆ = −48.3 + 9.00x . The correct
Interpretation of the slope is that for each additional
(Multiple Choice)
4.8/5 (40)
The following scatterplot shows monthly sales figures (in units) and number of
months of experience on the job for a sample of 19 salespeople. 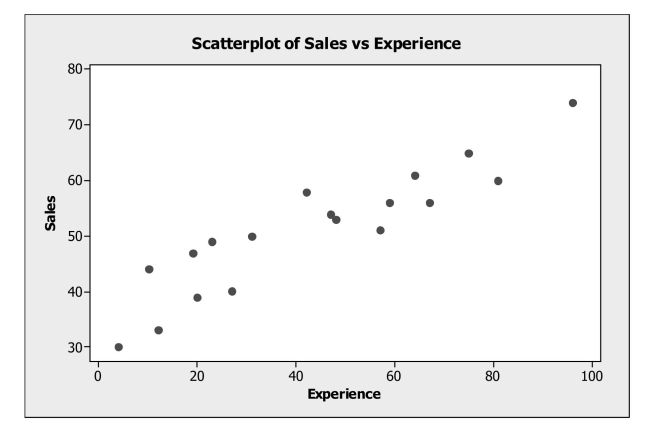 a. Describe the association between monthly sales and level of experience.
b. Do these data satisfy the conditions for computing a correlation coefficient? Explain.
c. Estimate the correlation.
a. Describe the association between monthly sales and level of experience.
b. Do these data satisfy the conditions for computing a correlation coefficient? Explain.
c. Estimate the correlation.
(Essay)
4.8/5 (41)
Write and interpret a linear regression equation.
-A small independent organic food store offers a variety of specialty coffees. To
Determine whether price has an impact on sales, the managers kept track of how many
Pounds of each variety of coffee were sold last month. Based on the data and summary
Statistics shown below, the slope of the estimated regression line that relates the response
Variable (monthly sales) to the predictor variable (price per pound) is PRICE PER POUND POUNDS SOLD \ 3.99 75 \ 5.99 60 \ 7.00 65 \ 12.00 45 \ 4.50 80 \ 7.50 70 \ 15.00 25 \ 10.00 35 \ 12.50 40 \ 8.99 50 Mean \ 8.75 54.50 Standard Deviation \ 3.63 18.33 Correlation
(Multiple Choice)
5.0/5 (37)
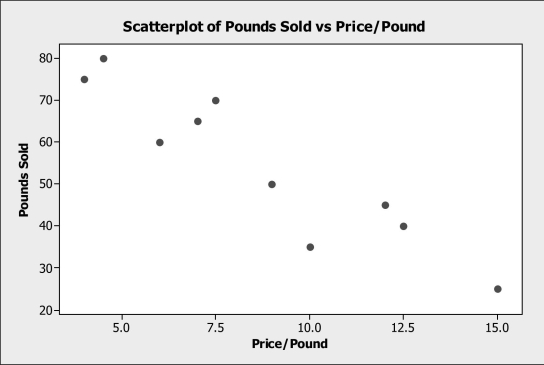
Use the following to answer questions 5 - 8.
A small independent organic food store offers a variety of specialty coffees. To
determine whether price has an impact on sales, the managers kept track of how many
pounds of each variety of coffee were sold last month. The data, scatterplot and
summary statistics are shown below. PRICE PER POUND POUNDS SOLD \ 3.99 75 \ 5.99 60 \ 7.00 65 \ 12.00 45 \ 4.50 80 \ 7.50 70 \ 15.00 25 \ 10.00 35 \ 12.50 40 \ 8.99 50 Mean \ 8.75 54.50 Standard Deviation \ 3.63 18.33 Correlation -0.927
 -Comment on whether each of the following conditions for correlation / linear
regression is met.
a. Quantitative variable condition.
b. Linearity condition.
c. Outlier condition.
-Comment on whether each of the following conditions for correlation / linear
regression is met.
a. Quantitative variable condition.
b. Linearity condition.
c. Outlier condition.
(Essay)
4.8/5 (30)
Use the following to answer questions 5 - 8.
A small independent organic food store offers a variety of specialty coffees. To
determine whether price has an impact on sales, the managers kept track of how many
pounds of each variety of coffee were sold last month. The data, scatterplot and
summary statistics are shown below. PRICE PER POUND POUNDS SOLD \ 3.99 75 \ 5.99 60 \ 7.00 65 \ 12.00 45 \ 4.50 80 \ 7.50 70 \ 15.00 25 \ 10.00 35 \ 12.50 40 \ 8.99 50 Mean \ 8.75 54.50 Standard Deviation \ 3.63 18.33 Correlation -0.927
-Find the value of R2. Interpret its meaning in this context.
(Essay)
4.8/5 (29)
Use the following to answer questions 5 - 8.
A small independent organic food store offers a variety of specialty coffees. To
determine whether price has an impact on sales, the managers kept track of how many
pounds of each variety of coffee were sold last month. The data, scatterplot and
summary statistics are shown below. PRICE PER POUND POUNDS SOLD \ 3.99 75 \ 5.99 60 \ 7.00 65 \ 12.00 45 \ 4.50 80 \ 7.50 70 \ 15.00 25 \ 10.00 35 \ 12.50 40 \ 8.99 50 Mean \ 8.75 54.50 Standard Deviation \ 3.63 18.33 Correlation -0.927
-Estimate the linear regression model that relates the response variable (monthly sales)
to the predictor variable (price per pound).
a. Find the slope of the regression line.
b. Find the intercept of the regression line.
c. Write the equation of the linear model.
(Essay)
4.8/5 (30)
Assign roles to variables.
-A supermarket chain gathers data on the amount they spend on promotional material
(e)g., coupons, etc.) and sales revenue generated each quarter. The predictor variable is
(Multiple Choice)
4.7/5 (32)
Analyze scatterplots and correlation coefficients.
-A small independent organic food store offers a variety of specialty coffees. To
Determine whether price has an impact on sales, the managers kept track of how many
Pounds of each variety of coffee were sold last month. Based on the scatterplot, the
Linear relationship between number of pounds of coffee sold per week and price is 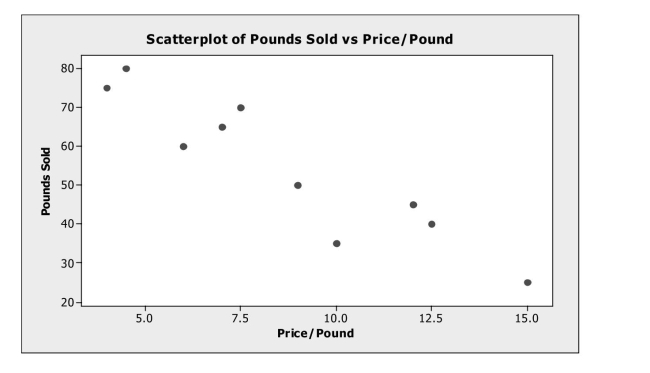
(Multiple Choice)
4.9/5 (29)
For each of the following scenarios indicate which is the predictor variable and which
is the response variable.
a. A supermarket chain gathers data on the amount they spend on promotional material
(specials, coupons, etc.) and sales revenue generated each quarter.
b. Government-sponsored research investigated the relationship between number of hours
individuals spend on the Internet and age.
c. A real estate association conducted a study on home prices and economic strength for
different regions of the United States.
(Essay)
4.7/5 (31)
Interpret the value of correlations coefficients and squared correlations.
-Suppose the correlation, r, between two variables x and y is -0.44. What percentage of
The variability in y cannot be explained by x?
(Multiple Choice)
4.9/5 (32)
Shown below is a correlation table showing correlation coefficients between
population (in millions), PC adoption, and cell phone adoption for a sample of 16
countries.
Correlations: PC Adoption, Cell Phone Adoption, Population (mill) PC Adoption Cell Phone Adoption Cell Phone Adoption 0.671 Population (mill) 0.376 0.016
a. What is the correlation between PC adoption and population? Interpret.
b. What is the correlation between cell phone adoption and population? Interpret.
c. What is the correlation between PC adoption and cell phone adoption? Interpret.
(Essay)
4.9/5 (31)
Use the following to answer questions 5 - 8.
A small independent organic food store offers a variety of specialty coffees. To
determine whether price has an impact on sales, the managers kept track of how many
pounds of each variety of coffee were sold last month. The data, scatterplot and
summary statistics are shown below. PRICE PER POUND POUNDS SOLD \ 3.99 75 \ 5.99 60 \ 7.00 65 \ 12.00 45 \ 4.50 80 \ 7.50 70 \ 15.00 25 \ 10.00 35 \ 12.50 40 \ 8.99 50 Mean \ 8.75 54.50 Standard Deviation \ 3.63 18.33 Correlation -0.927
-Using the estimated regression equation,
a. Estimate the monthly sales for a variety of coffee that costs $12 per pound.
b. What is the residual for this estimate?
What does it mean?
(Essay)
4.8/5 (33)
For each of the following scenarios indicate which is the predictor variable and which
is the response variable.
a. A study examined consumption levels of oil and carbon dioxide emissions for a sample
of counties.
b. Data were collected on job performance rating and hours of training for a sample of
employees at a telecommunications repair facility.
c. Salary data as well as years of managerial experience were collected for a sample of
executives in the high tech industry.
(Essay)
4.9/5 (36)
Interpret a linear regression equation and use it to make a prediction.
-Data were collected on monthly sales revenues (in $1,000s) and monthly advertising
Expenditures ($100s) for a sample of drug stores. The regression line relating revenues
(Y) to advertising expenditure (X) is estimated to be yˆ = −48.3 + 9.00x . The predicted
Sales revenue for a month in which $1,000 was spent on advertising is
(Multiple Choice)
4.9/5 (32)
Filters
- Essay(0)
- Multiple Choice(0)
- Short Answer(0)
- True False(0)
- Matching(0)