Exam 16: Inference for Regression
Exam 2: Data20 Questions
Exam 3: Surveys and Sampling26 Questions
Exam 4: Displaying and Describing Categorical Data21 Questions
Exam 5: Displaying and Describing Quantitative Data24 Questions
Exam 6: Correlation and Linear Regression36 Questions
Exam 7: Randomness and Probability28 Questions
Exam 8: Random Variables and Probability Models24 Questions
Exam 9: The Normal Distribution21 Questions
Exam 10: Confidence Intervals for Means20 Questions
Exam 11: Confidence Intervals for Proportions28 Questions
Exam 12: Confidence Intervals for Means21 Questions
Exam 13: Testing Hypotheses18 Questions
Exam 14: Comparing Two Groups19 Questions
Exam 15: Inference for Counts: Chi-Square20 Questions
Exam 16: Inference for Regression22 Questions
Exam 17: Understanding Residuals22 Questions
Exam 18: Multiple Regression15 Questions
Exam 19: Data13 Questions
Exam 22: Business Statistics20 Questions
Exam 24: Decision Making and Risk25 Questions
Exam 25: Introduction to Data Mining11 Questions
Exam 26: Exploring and Collecting Data43 Questions
Exam 27: Modeling With Probability20 Questions
Exam 28: Inference for Decision Making25 Questions
Exam 29: Models for Decision Making38 Questions
Exam 30: Selected Topics in Decision Making22 Questions
Select questions type
Interpret confidence and prediction intervals.
-A sales manager was interested in determining if there is a relationship between
College GPA and sales performance (number of units sold in the previous month) among
Salespeople hired within the last year. The estimated regression equation fit to the data
Was found to be significant at α = 0.05. The 95% confidence interval for the number of
Units sold when GPA = 3.00 was determined to be 20.914 to 22.657. The correct
Interpretation is
(Multiple Choice)
5.0/5  (39)
(39)
Interpret a scatterplot.
-An operations manager was interested in determining if there is a relationship between
The amount of training received by production line workers and the time it takes for them
To trouble shoot a process problem. A sample of recently trained line workers was
Selected. The number of hours of training time received and the time it took (in minutes)
For them to trouble shoot their last process problem were captured. Based on the
Scatterplot of the data shown below, we can say that 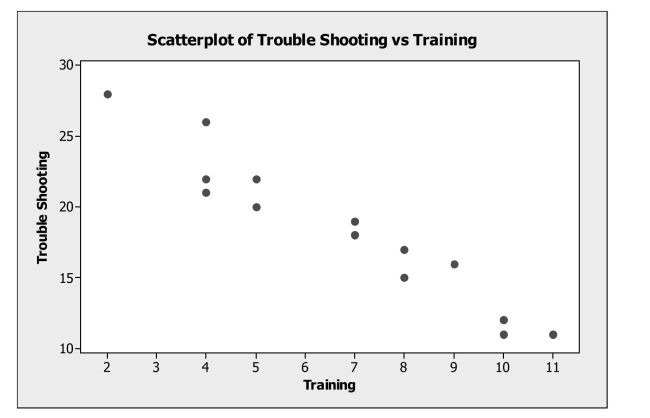
(Multiple Choice)
4.9/5 (35)
Filters
- Essay(0)
- Multiple Choice(0)
- Short Answer(0)
- True False(0)
- Matching(0)