Exam 3: Numerical Descriptive Measures
Exam 1: Defining and Collecting Data202 Questions
Exam 2: Organizing and Visualizing256 Questions
Exam 3: Numerical Descriptive Measures217 Questions
Exam 4: Basic Probability167 Questions
Exam 5: Discrete Probability Distributions165 Questions
Exam 6: The Normal Distribution and Other Continuous Distributions170 Questions
Exam 7: Sampling Distributions165 Questions
Exam 8: Confidence Interval Estimation219 Questions
Exam 9: Fundamentals of Hypothesis Testing: One-Sample Tests194 Questions
Exam 10: Two-Sample Tests240 Questions
Exam 11: Analysis of Variance170 Questions
Exam 12: Chi-Square and Nonparametric188 Questions
Exam 13: Simple Linear Regression243 Questions
Exam 14: Introduction to Multiple394 Questions
Exam 15: Multiple Regression146 Questions
Exam 16: Time-Series Forecasting235 Questions
Exam 17: Getting Ready to Analyze Data386 Questions
Exam 18: Statistical Applications in Quality Management159 Questions
Exam 19: Decision Making126 Questions
Exam 20: Probability and Combinatorics421 Questions
Select questions type
The line drawn within the box of the boxplot always represents the arithmetic
mean.
(True/False)
4.9/5  (30)
(30)
In left-skewed distributions, the distance from the smallest value to Q1 is greater
than the distance from Q3 to the largest value.
(True/False)
4.8/5 (37)
SCENARIO 3-14-B
You are the quality control manager of a water bottles company. One of the biggest complaints in the
past years has been the breakage and, hence, the concern on the durability of the connector between
the lid and the bottle which many users use as a handle for the bottles. To collect evidence before
implementing any modification to the production process, your department has subjected 100 water
bottles to a durability test and the following data on the number of times the handles have been used
to lift the bottles before they break are contained in the file Scenario3-14-DataB.XLSX. 493 506 515 491 500 505 517 510 506 503 503 491 495 496 496 505 493 486 504 483 514 494 497 501 493 490 510 494 494 495 494 486 495 506 506 507 502 498 510 501 500 505 492 486 501 496 501 521 510 498
-Referring to Scenario 3-14-B, the standard deviation of the number of times the handles have
been used to lift the bottles before they break in this sample is ________ percent of the mean.
(Short Answer)
4.8/5 (41)
SCENARIO 3-1
Health care issues are receiving much attention in both academic and political arenas. A sociologist
recently conducted a survey of citizens over 60 years of age whose net worth is too high to qualify for
Medicaid. The ages of 25 senior citizens were as follows: 60 61 62 63 64 65 66 68 68 69 70 73 73 74 75 76 76 81 81 82 86 87 89 90 92
-Referring to Scenario 3-1 determine the first quartile of the ages of the senior citizens.
(Short Answer)
5.0/5 (38)
SCENARIO 3-5
The rate of return of a Fortune 500 company over the past 15 years are: 3.17%, 4.43%, 5.93%, 5.43%,
7.29%, 8.21%, 6.23%, 5.23%, 4.34%, 6.68%, 7.14%, -5.56%, -5.23%, -5.73%, -10.34%
-Referring to Scenario 3-5, compute the arithmetic mean rate of return per year.
(Short Answer)
4.8/5 (36)
You were told that the 1st, 2nd and 3rd quartiles of female students' weight at a major university
are 95 lbs, 125 lbs, and 138 lbs. What percentage of the students weigh less than 95 lbs?
(Short Answer)
4.7/5 (29)
Which measure of central tendency can be used for both numerical and categorical variables?
(Multiple Choice)
4.8/5 (37)
SCENARIO 3-12
Given below are the rating and performance scores of 15 laptop computers. Performance Score 115 191 153 194 236 184 184 216 Overall Rating 74 78 79 80 84 76 77 92 Performance Score 185 183 189 202 192 141 187 Overall Rating 83 78 77 78 78 73 77
-Referring to Scenario 3-12, what is the sample covariance between the performance scores and
the rating?
(Short Answer)
4.9/5 (42)
Which of the following statistics is not a measure of central tendency?
(Multiple Choice)
4.9/5 (47)
The geometric mean is a measure of variation or dispersion in a set of data.
(True/False)
4.9/5 (34)
SCENARIO 3-14-A
You are the quality control manager of a water bottles company. One of the biggest complaints in the
past years has been the breakage and, hence, the concern on the durability of the connector between
the lid and the bottle which many users use as a handle for the bottles. To collect evidence before
implementing any modification to the production process, your department has subjected 100 water
bottles to a durability test and the following data on the number of times the handles have been used
to lift the bottles before they break are contained in the file Scenario3-14-DataA.XLSX. 495 499 502 500 491 498 498 495 488 516 513 486 504 503 493 504 489 500 495 499 501 507 511 496 486 497 510 504 493 482 511 502 520 514 486 514 500 505 512 500 504 498 503 514 474 489 488 506 517 490
-Referring to Scenario 3-14-A, the arithmetic mean of the number of times the handles have
been used to lift the bottles before they break in this sample is ________.
(Short Answer)
4.9/5 (44)
SCENARIO 3-14-B
You are the quality control manager of a water bottles company. One of the biggest complaints in the
past years has been the breakage and, hence, the concern on the durability of the connector between
the lid and the bottle which many users use as a handle for the bottles. To collect evidence before
implementing any modification to the production process, your department has subjected 100 water
bottles to a durability test and the following data on the number of times the handles have been used
to lift the bottles before they break are contained in the file Scenario3-14-DataB.XLSX. 493 506 515 491 500 505 517 510 506 503 503 491 495 496 496 505 493 486 504 483 514 494 497 501 493 490 510 494 494 495 494 486 495 506 506 507 502 498 510 501 500 505 492 486 501 496 501 521 510 498
-Referring to Scenario 3-14-B, construct a boxplot for the data in this sample.
(Essay)
5.0/5 (33)
SCENARIO 3-14-B
You are the quality control manager of a water bottles company. One of the biggest complaints in the
past years has been the breakage and, hence, the concern on the durability of the connector between
the lid and the bottle which many users use as a handle for the bottles. To collect evidence before
implementing any modification to the production process, your department has subjected 100 water
bottles to a durability test and the following data on the number of times the handles have been used
to lift the bottles before they break are contained in the file Scenario3-14-DataB.XLSX. 493 506 515 491 500 505 517 510 506 503 503 491 495 496 496 505 493 486 504 483 514 494 497 501 493 490 510 494 494 495 494 486 495 506 506 507 502 498 510 501 500 505 492 486 501 496 501 521 510 498
-Referring to Scenario 3-14-B, the variance of the number of times the handles have been used
to lift the bottles before they break in this sample is ________.
(Short Answer)
4.8/5 (35)
SCENARIO 3-4
The ordered array below represents the number of cargo manifests approved by customs inspectors of
the Port of New York in a sample of 35 days:
16, 17, 18, 18, 19, 20, 20, 21, 21, 21, 22, 22, 22, 22, 23, 23, 23, 23, 24, 24, 24, 25, 25, 26, 26, 26, 27,
28, 28, 29, 29, 31, 31, 32, 32
Note: For this sample, the sum of the values is 838, and the sum of the squared differences between
each value and the mean is 619.89.
-Referring to Scenario 3-4, the five-number summary for the data in the customs sample
consists of ________, ________, ________, ________, ________.
(Short Answer)
4.8/5 (31)
Data on the change in the cost of tuition, a shared dormitory room, and the most popular meal plan from one academic year to the next academic year for a sample of 100 public
Universities are collected. Below is the boxplot for the change in cost in dollars. The
Distribution of the change in cost is 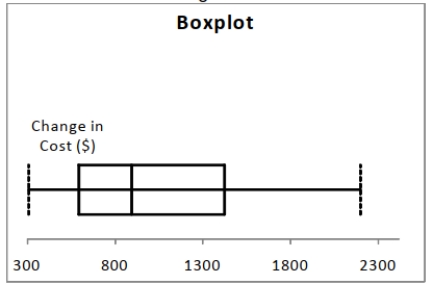
(Multiple Choice)
4.9/5 (31)
SCENARIO 3-8
The time period from 2010 to 2013 saw a great deal of volatility in the value of stocks. The data in
the following table represent the total rate of return of our companies from 2010 to 2013. Year Company A Company B Company C Company D 2013 25.30 26.40 45.40 29.40 2012 -15.01 -22.10 -21.58 -20.90 2011 -5.44 -11.90 -1.03 -10.97 2010 -6.20 -9.10 -3.02 -10.89
-Referring to Scenario 3-8, calculate the geometric mean rate of return per year for Company B.
(Short Answer)
4.7/5 (29)
In a set of numerical data, the value for Q2 is always halfway between Q1 and Q3.
(True/False)
4.9/5 (33)
Which of the following is NOT a measure of central tendency?
(Multiple Choice)
4.9/5 (34)
SCENARIO 3-14-B
You are the quality control manager of a water bottles company. One of the biggest complaints in the
past years has been the breakage and, hence, the concern on the durability of the connector between
the lid and the bottle which many users use as a handle for the bottles. To collect evidence before
implementing any modification to the production process, your department has subjected 100 water
bottles to a durability test and the following data on the number of times the handles have been used
to lift the bottles before they break are contained in the file Scenario3-14-DataB.XLSX. 493 506 515 491 500 505 517 510 506 503 503 491 495 496 496 505 493 486 504 483 514 494 497 501 493 490 510 494 494 495 494 486 495 506 506 507 502 498 510 501 500 505 492 486 501 496 501 521 510 498
-Referring to Scenario 3-14-B, the difference between the most and the least number of times
the handles have been used to lift the bottles before they break in this sample is ________.
(Short Answer)
4.7/5 (37)
SCENARIO 3-2
The data below represent the amount of grams of carbohydrates in a serving of breakfast cereal in a
sample of 11 different servings. 11 15 23 29 19 22 21 20 15 25 17
-Referring to Scenario 3-2, the five-number summary of the carbohydrate amounts consists of
________, ________, ________, ________, ________.
(Short Answer)
4.9/5 (31)
Filters
- Essay(0)
- Multiple Choice(0)
- Short Answer(0)
- True False(0)
- Matching(0)