Exam 3: Numerical Descriptive Measures
Exam 1: Defining and Collecting Data202 Questions
Exam 2: Organizing and Visualizing256 Questions
Exam 3: Numerical Descriptive Measures217 Questions
Exam 4: Basic Probability167 Questions
Exam 5: Discrete Probability Distributions165 Questions
Exam 6: The Normal Distribution and Other Continuous Distributions170 Questions
Exam 7: Sampling Distributions165 Questions
Exam 8: Confidence Interval Estimation219 Questions
Exam 9: Fundamentals of Hypothesis Testing: One-Sample Tests194 Questions
Exam 10: Two-Sample Tests240 Questions
Exam 11: Analysis of Variance170 Questions
Exam 12: Chi-Square and Nonparametric188 Questions
Exam 13: Simple Linear Regression243 Questions
Exam 14: Introduction to Multiple394 Questions
Exam 15: Multiple Regression146 Questions
Exam 16: Time-Series Forecasting235 Questions
Exam 17: Getting Ready to Analyze Data386 Questions
Exam 18: Statistical Applications in Quality Management159 Questions
Exam 19: Decision Making126 Questions
Exam 20: Probability and Combinatorics421 Questions
Select questions type
SCENARIO 3-14-A
You are the quality control manager of a water bottles company. One of the biggest complaints in the
past years has been the breakage and, hence, the concern on the durability of the connector between
the lid and the bottle which many users use as a handle for the bottles. To collect evidence before
implementing any modification to the production process, your department has subjected 100 water
bottles to a durability test and the following data on the number of times the handles have been used
to lift the bottles before they break are contained in the file Scenario3-14-DataA.XLSX. 495 499 502 500 491 498 498 495 488 516 513 486 504 503 493 504 489 500 495 499 501 507 511 496 486 497 510 504 493 482 511 502 520 514 486 514 500 505 512 500 504 498 503 514 474 489 488 506 517 490
-Referring to Scenario 3-14-A, the standard deviation of the number of times the handles have
been used to lift the bottles before they break in this sample is ________.
(Short Answer)
4.7/5  (35)
(35)
SCENARIO 3-14-B
You are the quality control manager of a water bottles company. One of the biggest complaints in the
past years has been the breakage and, hence, the concern on the durability of the connector between
the lid and the bottle which many users use as a handle for the bottles. To collect evidence before
implementing any modification to the production process, your department has subjected 100 water
bottles to a durability test and the following data on the number of times the handles have been used
to lift the bottles before they break are contained in the file Scenario3-14-DataB.XLSX. 493 506 515 491 500 505 517 510 506 503 503 491 495 496 496 505 493 486 504 483 514 494 497 501 493 490 510 494 494 495 494 486 495 506 506 507 502 498 510 501 500 505 492 486 501 496 501 521 510 498
-Referring to Scenario 3-14-B, is the number of times the handles have been used to lift the
bottles before they break in this sample right- or left- skewed?
(Short Answer)
4.9/5 (37)
SCENARIO 3-12
Given below are the rating and performance scores of 15 laptop computers. Performance Score 115 191 153 194 236 184 184 216 Overall Rating 74 78 79 80 84 76 77 92 Performance Score 185 183 189 202 192 141 187 Overall Rating 83 78 77 78 78 73 77
-Referring to Scenario 3-12, for a laptop computer that has a high rating, you will expect its performance score to
(Multiple Choice)
5.0/5 (40)
SCENARIO 3-7
In a recent academic year, many public universities in the United States raised tuition and fees due to
a decrease in state subsidies. The change in the cost of tuition, a shared dormitory room, and the most
popular meal plan from the previous academic year for a sample of 10 public universities were as
follows: $1,589, $593, $1,223, $869, $423, $1,720, $708, $1425, $922 and $308.
-Referring to Scenario 3-7, what is the kurtosis statistic of the change in the cost?
(Short Answer)
4.8/5 (32)
SCENARIO 3-14-B
You are the quality control manager of a water bottles company. One of the biggest complaints in the
past years has been the breakage and, hence, the concern on the durability of the connector between
the lid and the bottle which many users use as a handle for the bottles. To collect evidence before
implementing any modification to the production process, your department has subjected 100 water
bottles to a durability test and the following data on the number of times the handles have been used
to lift the bottles before they break are contained in the file Scenario3-14-DataB.XLSX. 493 506 515 491 500 505 517 510 506 503 503 491 495 496 496 505 493 486 504 483 514 494 497 501 493 490 510 494 494 495 494 486 495 506 506 507 502 498 510 501 500 505 492 486 501 496 501 521 510 498
-Referring to Scenario 3-14-B, three quarters of the bottles in this sample have a broken handle
after being used to lift the bottles for less than how many times?
(Short Answer)
4.8/5 (35)
If the data set is approximately bell-shaped, the empirical rule will more accurately
reflect the greater concentration of data close to the mean as compared to the Chebyshev rule.
(True/False)
4.7/5 (41)
SCENARIO 3-14-A
You are the quality control manager of a water bottles company. One of the biggest complaints in the
past years has been the breakage and, hence, the concern on the durability of the connector between
the lid and the bottle which many users use as a handle for the bottles. To collect evidence before
implementing any modification to the production process, your department has subjected 100 water
bottles to a durability test and the following data on the number of times the handles have been used
to lift the bottles before they break are contained in the file Scenario3-14-DataA.XLSX. 495 499 502 500 491 498 498 495 488 516 513 486 504 503 493 504 489 500 495 499 501 507 511 496 486 497 510 504 493 482 511 502 520 514 486 514 500 505 512 500 504 498 503 514 474 489 488 506 517 490
-Referring to Scenario 3-14-A, the middle 50% of the bottles have the number of times the
handles have been used to lift the bottles before they break spread over what value?
(Short Answer)
4.9/5 (39)
The larger the Z score, the farther is the distance from the value to the median.
(True/False)
4.8/5 (32)
SCENARIO 3-3
The ordered array below represents the number of vitamin supplements sold by a health food store in
a sample of 16 days.
19, 19, 20, 20, 22, 23, 25, 26, 27, 30, 33, 34, 35, 36, 38, 41
Note: For this sample, the sum of the values is 448, and the sum of the squared differences between
each value and the mean is 812.
-Referring to Scenario 3-3, the variance of the number of vitamin supplements sold in this sample
is ________.
(Short Answer)
4.8/5 (40)
According to the Chebyshev rule, at least what percentage of the observations in any data set are contained within a distance of 2 standard deviations around the mean?
(Multiple Choice)
4.8/5 (35)
SCENARIO 3-3
The ordered array below represents the number of vitamin supplements sold by a health food store in
a sample of 16 days.
19, 19, 20, 20, 22, 23, 25, 26, 27, 30, 33, 34, 35, 36, 38, 41
Note: For this sample, the sum of the values is 448, and the sum of the squared differences between
each value and the mean is 812.
-Referring to Scenario 3-3, the five-number summary of the data in this sample consists of
________, ________, ________, ________, ________.
(Short Answer)
4.9/5 (41)
SCENARIO 3-3
The ordered array below represents the number of vitamin supplements sold by a health food store in
a sample of 16 days.
19, 19, 20, 20, 22, 23, 25, 26, 27, 30, 33, 34, 35, 36, 38, 41
Note: For this sample, the sum of the values is 448, and the sum of the squared differences between
each value and the mean is 812.
-Referring to Scenario 3-3, construct a boxplot for the data in this sample.
(Essay)
4.8/5 (29)
Which descriptive summary measures are considered to be resistant statistics?
(Multiple Choice)
4.8/5 (40)
SCENARIO 3-8
The time period from 2010 to 2013 saw a great deal of volatility in the value of stocks. The data in
the following table represent the total rate of return of our companies from 2010 to 2013. Year Company A Company B Company C Company D 2013 25.30 26.40 45.40 29.40 2012 -15.01 -22.10 -21.58 -20.90 2011 -5.44 -11.90 -1.03 -10.97 2010 -6.20 -9.10 -3.02 -10.89
-Referring to Scenario 3-8, calculate the geometric mean rate of return per year for Company C.
(Short Answer)
4.7/5 (32)
SCENARIO 3-11
Given below are the closing prices for the Dow Jones Industrial Average (DJIA) and the Standard &
Poor's (S&P) 500 Index over a 10-week sometime in the past. Dow Jones 10,421 10,110 9,862 10,475 9,920 10,592 11,213 10,933 11,134 10,316 S\&P 500 1,379 1,356 1,343 1,410 1,389 1,463 1,529 1,499 1,516 1,355
-Referring to Scenario 3-11, how will you classify the linear relationship between the DJIA and the S&P 500 index?
(Multiple Choice)
4.9/5 (42)
SCENARIO 3-14-B
You are the quality control manager of a water bottles company. One of the biggest complaints in the
past years has been the breakage and, hence, the concern on the durability of the connector between
the lid and the bottle which many users use as a handle for the bottles. To collect evidence before
implementing any modification to the production process, your department has subjected 100 water
bottles to a durability test and the following data on the number of times the handles have been used
to lift the bottles before they break are contained in the file Scenario3-14-DataB.XLSX. 493 506 515 491 500 505 517 510 506 503 503 491 495 496 496 505 493 486 504 483 514 494 497 501 493 490 510 494 494 495 494 486 495 506 506 507 502 498 510 501 500 505 492 486 501 496 501 521 510 498
-Referring to Scenario 3-14-B, the range of the number of times the handles have been used to
lift the bottles before they break in this sample is ________.
(Short Answer)
4.7/5 (33)
SCENARIO 3-3
The ordered array below represents the number of vitamin supplements sold by a health food store in
a sample of 16 days.
19, 19, 20, 20, 22, 23, 25, 26, 27, 30, 33, 34, 35, 36, 38, 41
Note: For this sample, the sum of the values is 448, and the sum of the squared differences between
each value and the mean is 812.
-Referring to Scenario 3-3, the arithmetic mean of the number of vitamin supplements sold in this
sample is ________.
(Short Answer)
4.8/5 (45)
SCENARIO 3-3
The ordered array below represents the number of vitamin supplements sold by a health food store in
a sample of 16 days.
19, 19, 20, 20, 22, 23, 25, 26, 27, 30, 33, 34, 35, 36, 38, 41
Note: For this sample, the sum of the values is 448, and the sum of the squared differences between
each value and the mean is 812.
-Referring to Scenario 3-3, the kurtosis statistic of the number of vitamin supplements sold in this
sample is ________.
(Short Answer)
4.9/5 (39)
A population with 200 elements has an arithmetic mean of 10. From this
information, it can be shown that the population standard deviation is 15.
(True/False)
4.9/5 (31)
A manufacturer of flashlight batteries took a sample of 130 batteries from a day's production and used them continuously until they were drained. The number of hours until failure are recorded.
Given below is the boxplot of the number of hours it took to drain each of the 130 batteries. The
Distribution of the number of hours is 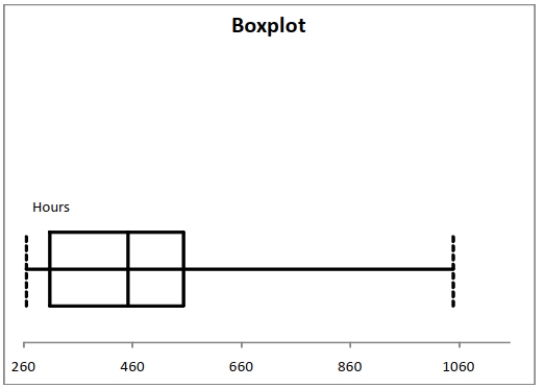
(Multiple Choice)
4.7/5 (43)
Filters
- Essay(0)
- Multiple Choice(0)
- Short Answer(0)
- True False(0)
- Matching(0)