Exam 2: Graphs and Functions
Exam 1: Equations and Inequalities494 Questions
Exam 2: Graphs and Functions525 Questions
Exam 3: Polynomial and Rational Functions516 Questions
Exam 4: Inverse, Exponential, and Logarithmic Functions471 Questions
Exam 5: Trigonometric Functions301 Questions
Exam 6: The Circular Functions and Their Graphs289 Questions
Exam 7: Trigonometric Identities and Equations494 Questions
Exam 8: Applications of Trigonometry446 Questions
Exam 9: Systems and Matrices505 Questions
Exam 10: Analytic Geometry206 Questions
Exam 11: Further Topics in Algebra351 Questions
Exam 12: Review of Basic Concepts640 Questions
Select questions type
The graph of y = f(x) is given. Use the graph to find the function value.
-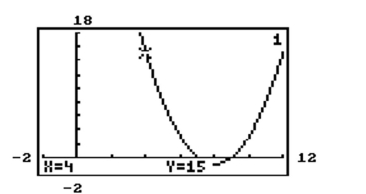 Find .
(Multiple Choice)
4.8/5  (42)
(42)
Find the center-radius form of the equation of the circle.
-center , radius 9
(Multiple Choice)
4.8/5 (32)
Suppose the point (2, 4) is on the graph of y = f(x). Find a point on the graph of the given function.
-y = f(x) + 10
(Multiple Choice)
4.9/5 (42)
Write an equation for the line described. Give your answer in slope-intercept form.
-
(Multiple Choice)
4.7/5 (28)
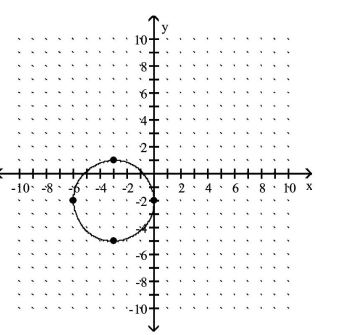
Use the graph to determine the equation of the circle in center-radius form.
-
(Multiple Choice)
4.8/5 (37)
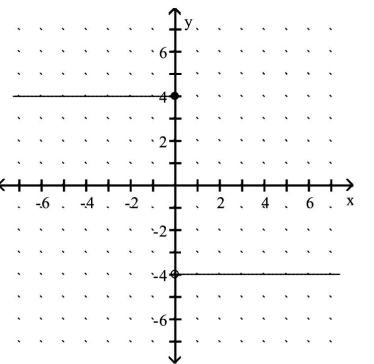
Give a rule for the piecewise-defined function. Then give the domain and range.
-
(Multiple Choice)
4.9/5 (41)
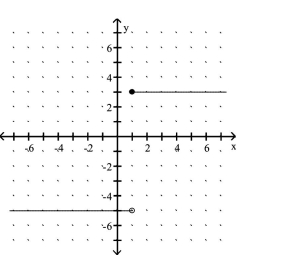
Give a rule for the piecewise-defined function. Then give the domain and range.
-
(Multiple Choice)
4.8/5 (29)
Solve the problem.
-Find the center-radius form of the equation of a circle with center and tangent to the -axis.
(Multiple Choice)
4.8/5 (36)
Decide whether the relation defines a function.
-{(-5, -4), (-2, -6), (3, 6), (7, -9)}
(Multiple Choice)
4.8/5 (38)
A new chocolate company is estimating how many candy bars per week college students will consume of their line of
products. The graph shows the probable number of candy bars students (age 18 -22) will consume from year 0 to year 10.
B(x) gives the number of candy bars for boys, G(x) gives the number of candy bars for girls, and T(x) gives the total
number for both groups. Use the graph to answer the question. 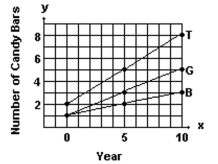 -Use the slopes of the line segments to decide in which period (0-5 or 5-10) the number of candy bars per week increased more rapidly.
(Multiple Choice)
4.8/5 (44)
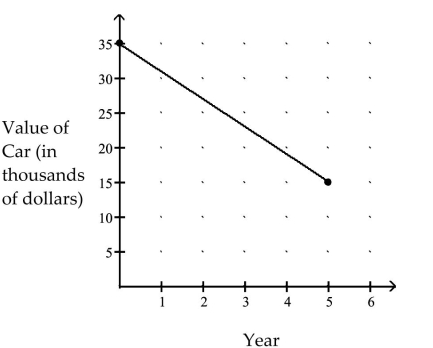
Find the average rate of change illustrated in the graph.
-
(Multiple Choice)
4.7/5 (30)
Suppose the point (2, 4) is on the graph of y = f(x). Find a point on the graph of the given function.
-The reflection of the graph of y = f(x) across the x-axis
(Multiple Choice)
4.9/5 (39)
Solve the problem.
-The cost of manufacturing clocks is given by . Also, it is known that in hours the number of clocks that can be produced is given by , where . Express as a function of .
(Multiple Choice)
4.8/5 (37)
Filters
- Essay(0)
- Multiple Choice(0)
- Short Answer(0)
- True False(0)
- Matching(0)