Exam 3: Data Description
Exam 1: The Nature of Probability and Statistics81 Questions
Exam 2: Frequency Distributions and Graphs107 Questions
Exam 3: Data Description127 Questions
Exam 4: Probability and Counting Rules173 Questions
Exam 5: Discrete Probability Distributions117 Questions
Exam 6: The Normal Distribution114 Questions
Exam 7: Confidence Intervals and Sample Size122 Questions
Exam 8: Hypothesis Testing178 Questions
Exam 9: Testing the Difference Between Two Means, Two Variances, and Two Proportions99 Questions
Exam 10: Correlation and Regression73 Questions
Exam 11: Other Chi-Square Tests73 Questions
Exam 12: Analysis of Variance69 Questions
Exam 13: Nonparametric Statistics62 Questions
Exam 14: Sampling and Simulation58 Questions
Select questions type
For the data set below, find the 53 rd percentile. 64 95 74 70 32 58 24 46 25 17 59 51 7 60 36 67 67 54 33 60
(Multiple Choice)
4.8/5  (39)
(39)
Find the mode for the following data? 5, 4, 3, 4, 5, 6, 5, 5, 3, 4
(Multiple Choice)
4.8/5 (41)
The following data represent the total price, in dollars, of 20 randomly-selected gasoline purchases at a certain convenience store.
65.11 58.35 53.36 70.22 57.31 44.17 41.53 71.76 49.11 58.8 78.90 62.13 46.36 75.27 47.79 54.39 10.11 47.10 48.23 68.6
Which value in this data set is most accurately described as an extreme value?
(Multiple Choice)
4.8/5 (33)
A population has a mean and standard deviation . Find the -score for a population value of 40 .
(Multiple Choice)
4.8/5 (32)
The table below lists the populations, in thousands, of several rural western counties. Wh: mean population?
County Population (thousands) Aldridge 17 Cleveland 20 McCarthy 12 Pope 22 Sorrell 19 Wilson 18
is the
(Multiple Choice)
4.8/5 (39)
What is the median of the following set of values? 2, 16, 14, 10, 14, 9, 10, 14
(Multiple Choice)
4.9/5 (39)
A data set has a mean of 70 and a standard deviation of 10. Which of the following might possibly be true?
(Multiple Choice)
4.7/5 (41)
A baseball player has a batting average of each week of the season, with a standard deviation of . What is the score when he bats one week?
(Multiple Choice)
4.9/5 (45)
A weighted mean is used when the values of the data set are not all equally represented.
(True/False)
4.8/5 (38)
divide a distribution into four groups, and divide a
distribution into ten groups.
(Short Answer)
4.9/5 (39)
For the data shown in the histogram, which of the following choices best describes the rel between the median and the mean?
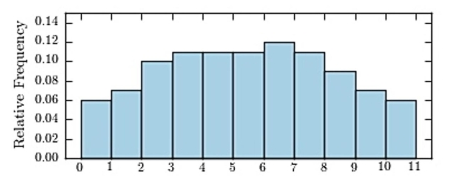
(Multiple Choice)
4.8/5 (41)
For the data set 1, 8, 7, 2, 9, 15, 18, the properly rounded mean is 9.
(True/False)
4.9/5 (41)
The following table presents the heights (in inches) of a sample of college basketball play
Height (in.) Frequency 68-71 3 72-75 5 76-79 2 80-83 2 84-87 2
Considering the data to be a population, approximate the variance of the heights. .
(Multiple Choice)
4.9/5 (36)
Approximate the sample variance given the following frequency distribution. Class Frequency 0-19 14 20-39 15 40-59 9 60-79 9 80-99 9
(Multiple Choice)
4.9/5 (35)
Using the table below, what grade would a student who ranked in the 50th percentile receive.
Grade Class Boundaries Frequency A 89.5-99.5 4 B 79.5-89.5 7 C 69.5-79.5 11 D 59.5-69.5 3 F 49.5-59.5 3
(Multiple Choice)
4.8/5 (35)
For a set of data with a mean of 6 and a variance of 9, approximately 68% of the values
will fall between 3 to 9.
(True/False)
4.7/5 (34)
The following table presents the heights (in inches) of a sample of college basketball play
Height (in.) Frequency 68-71 11 72-75 56 76-79 54 80-83 40 84-87 13
Considering the data to be a population, approximate the standard deviation of the heights .
(Multiple Choice)
4.9/5 (45)
The following data represent the ice cream flavor choices of 20 diners at a college cafeter
Chocolate Vanilla Chocolate Rocky Road Vanilla Rocky Road Vanilla Vanilla Rocky Road Vanilla Rocky Road Chocolate Choc. Chip Moose Tracks Chocolate Choc. Chip Rocky Road Vanilla Vanilla Choc. Chip
Which flavor ice cream is the mode?
(Multiple Choice)
5.0/5 (40)
Filters
- Essay(0)
- Multiple Choice(0)
- Short Answer(0)
- True False(0)
- Matching(0)