Exam 3: Data Description
Exam 1: The Nature of Probability and Statistics81 Questions
Exam 2: Frequency Distributions and Graphs107 Questions
Exam 3: Data Description127 Questions
Exam 4: Probability and Counting Rules173 Questions
Exam 5: Discrete Probability Distributions117 Questions
Exam 6: The Normal Distribution114 Questions
Exam 7: Confidence Intervals and Sample Size122 Questions
Exam 8: Hypothesis Testing178 Questions
Exam 9: Testing the Difference Between Two Means, Two Variances, and Two Proportions99 Questions
Exam 10: Correlation and Regression73 Questions
Exam 11: Other Chi-Square Tests73 Questions
Exam 12: Analysis of Variance69 Questions
Exam 13: Nonparametric Statistics62 Questions
Exam 14: Sampling and Simulation58 Questions
Select questions type
Find the population variance for the following data set: 26 28 16 23 20
(Multiple Choice)
4.9/5  (44)
(44)
A recent survey of a new diet cola reported the following percentages of people who likec taste. Find the weighted mean of the percentages.
Area \% Favored Number surveyed 1 30 2500 2 25 1500 3 50 3000 d the
(Multiple Choice)
4.8/5 (45)
The average weight of adult male bison in a particular federal wildlife preserve is 1450 pounds with a standard deviation of 240 pounds. Find the weight of an adult bull whose -score is .
(Multiple Choice)
4.9/5 (35)
The size of the box in a boxplot shows the of the data set.
(Multiple Choice)
4.7/5 (42)
The average resident of Metro City produces 570 pounds of solid waste each year, and the standard deviation is approximately 70 pounds. Use Chebyshev's theorem to find the
Weight range that contains at least 75% of all residents' annual garbage weights.
(Multiple Choice)
4.9/5 (38)
The range of a data set is the difference between the highest value and the lowest value.
(True/False)
4.8/5 (32)
Approximate the sample standard deviation given the following frequency distribution. Class Frequency 0-14 11 15-29 8 30-44 10 45-59 9 60-74 14
(Multiple Choice)
4.8/5 (39)
The average age of Stokes County school board members over the last 40 years has been 46, but members have ranged from 29 to 67. Use the range rule of thumb to estimate the
Standard deviation of the members' ages.
(Multiple Choice)
4.9/5 (35)
If a student scored 76 points on a test where the mean score was and the standard deviation was 6.1. The student's score is________
(Multiple Choice)
4.8/5 (40)
Gina and Stewart are surf-fishing on the Atlantic coast, where both bluefish and pompano are common catches. The mean length of a bluefish is 264 millimeters with a standard deviation of . For pompano, the mean is with a standard deviation of .
Stewart caught a bluefish that was long. What was the -score for this length?
(Multiple Choice)
4.8/5 (30)
Determine the range for the following data set. 6, 19, 10, 8, 26
(Multiple Choice)
5.0/5 (38)
The interquartile range IQR is found by subtracting the mean from the maximum value
of a data set.
(True/False)
4.8/5 (36)
The following population parameters were obtained from a graphing calculator.
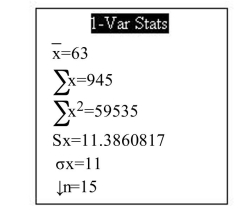 Assuming the population is bell-shaped, between what two values will approximately population be?
(Multiple Choice)
4.7/5 (40)
Given that the mean of a set of data is 25 and the standard deviation is 3, what is the coefficient of variation?
(Multiple Choice)
4.7/5 (41)
The is the average of the squares of the distance each value is
from the mean.
(Short Answer)
4.8/5 (40)
Which plot below has a five-number summary of and an interquartile range of 5 ?
(Multiple Choice)
4.9/5 (36)
According to Chebyshev's theorem, the maximum proportion of data values from a data set that are more than 1.5 standard deviations from the mean is .
(Multiple Choice)
4.8/5 (40)
What is the mean of the following data set? 4, 8, 11, 12, 13
(Multiple Choice)
4.8/5 (37)
The grades for the trigonometry exam are listed below. Find the range. 85, 76, 93, 82, 84, 90, 75
(Multiple Choice)
5.0/5 (36)
Filters
- Essay(0)
- Multiple Choice(0)
- Short Answer(0)
- True False(0)
- Matching(0)