Exam 3: Data Description
Exam 1: The Nature of Probability and Statistics81 Questions
Exam 2: Frequency Distributions and Graphs107 Questions
Exam 3: Data Description127 Questions
Exam 4: Probability and Counting Rules173 Questions
Exam 5: Discrete Probability Distributions117 Questions
Exam 6: The Normal Distribution114 Questions
Exam 7: Confidence Intervals and Sample Size122 Questions
Exam 8: Hypothesis Testing178 Questions
Exam 9: Testing the Difference Between Two Means, Two Variances, and Two Proportions99 Questions
Exam 10: Correlation and Regression73 Questions
Exam 11: Other Chi-Square Tests73 Questions
Exam 12: Analysis of Variance69 Questions
Exam 13: Nonparametric Statistics62 Questions
Exam 14: Sampling and Simulation58 Questions
Select questions type
Determine the range for the following data set. 4, 7, 3, 16, 5, 22, 8
(Multiple Choice)
5.0/5  (37)
(37)
The completion times for a certain marathon race was 3 hours with a standard deviation of hours. What can you determine about these data by using Chebyshev's Inequality with ?
(Multiple Choice)
4.9/5 (28)
The and are two measures of variation
used to describe the spread of the data in a data set.
(Short Answer)
4.8/5 (29)
Which of the following is the properly rounded mean for the given data? 7, 8, 13, 9, 10, 11
(Multiple Choice)
4.8/5 (33)
The following population parameters were obtained from a graphing calculator.
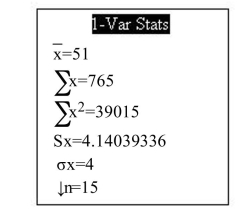 Assuming the population is bell-shaped, approximately what percentage of the population are between 39 and 63 ? lues
(Multiple Choice)
4.8/5 (43)
Construct a boxplot for the data set below.
11 20 20 27 11 14 14 10 15 14 34 18 11 17 14 22 25 21 20 10
(Multiple Choice)
4.8/5 (43)
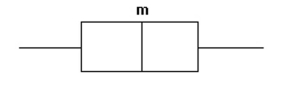
Given the following boxplot where is the median value, what statement could be made about the distribution of the data?
(Multiple Choice)
4.8/5 (32)
Approximate the population standard deviation given the following frequency distributior Class Frequency 0-9 11 10-19 13 20-29 19 30-39 12 40-49 14
(Multiple Choice)
4.8/5 (35)
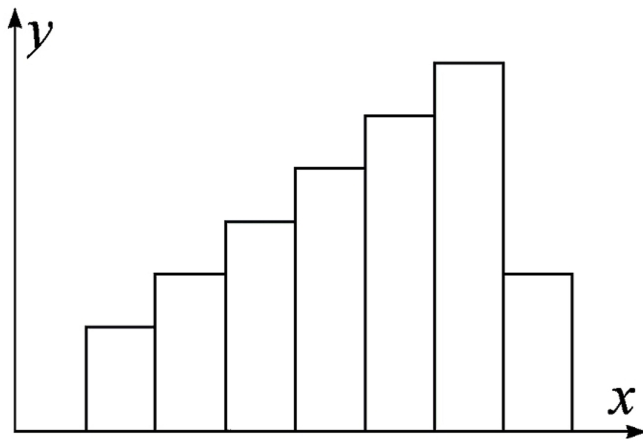
For which of the following histograms is it appropriate to use the Empirical Rule?
(Multiple Choice)
4.9/5 (43)
The average weekly earnings in dollars for various industries are listed below. Find the percentile rank of 683.
755, 683, 604, 706, 649, 729, 800, 547, 821, 851
(Multiple Choice)
4.9/5 (29)
If a distribution is negatively skewed as shown in the figure below, the mean will fall to the right of the median and the mode will fall to the left of the median.
(True/False)
4.8/5 (42)
Find the median for the following data. 6, 7, 4, 5, 3, 7, 4
(Multiple Choice)
4.8/5 (33)
What is the midrange of the following data set? 5, 11, 10, 12, 4, 12, 18, 18, 18
(Multiple Choice)
4.9/5 (47)
Find the mean for the following data set: 25 24 21 13 14 15
(Multiple Choice)
4.7/5 (37)
For the data set below, find the third quartile. 72 72 67 68 75 73 73 70 65 79 79
(Multiple Choice)
4.7/5 (29)
Construct a boxplot for the data set below.
94 96 89 90 90 89 88 85 85 88 92 91 91 90 90 90 93 89 82 84
(Multiple Choice)
4.9/5 (36)
Find the mode for the following data set: 10 30 10 36 26 22
(Multiple Choice)
4.9/5 (32)
Find the median for the following data set: 25 20 24 14 10 15
(Multiple Choice)
4.8/5 (43)
Filters
- Essay(0)
- Multiple Choice(0)
- Short Answer(0)
- True False(0)
- Matching(0)