Exam 3: Data Description
Exam 1: The Nature of Probability and Statistics81 Questions
Exam 2: Frequency Distributions and Graphs107 Questions
Exam 3: Data Description127 Questions
Exam 4: Probability and Counting Rules173 Questions
Exam 5: Discrete Probability Distributions117 Questions
Exam 6: The Normal Distribution114 Questions
Exam 7: Confidence Intervals and Sample Size122 Questions
Exam 8: Hypothesis Testing178 Questions
Exam 9: Testing the Difference Between Two Means, Two Variances, and Two Proportions99 Questions
Exam 10: Correlation and Regression73 Questions
Exam 11: Other Chi-Square Tests73 Questions
Exam 12: Analysis of Variance69 Questions
Exam 13: Nonparametric Statistics62 Questions
Exam 14: Sampling and Simulation58 Questions
Select questions type
A data set has a mean of 177 and a standard deviation of 20. Compute the coefficient of variation.
(Multiple Choice)
4.9/5  (44)
(44)
Gina and Stewart are surf-fishing on the Atlantic coast, where both bluefish and pompano are common catches. The mean length of a bluefish is 288 millimeters with a
Standard deviation of 63 mm. For pompano, the mean is 128 mm with a standard
Deviation of 31 mm.
Stewart caught a bluefish that was 307 mm long, and Gina caught a pompano that was
189 mm long. Who caught the longer fish, relative to fish of the same species?
(Multiple Choice)
4.8/5 (40)
A random sample of weights (in carats) of sapphires in a jeweler's collection is shown. Fi the mean of the sample.
Class Boundaries Frequency 0.95-2.95 10 2.95-4.95 15 4.95-6.95 10 6.95-8.95 10 8.95-10.95 9
(Multiple Choice)
4.8/5 (39)
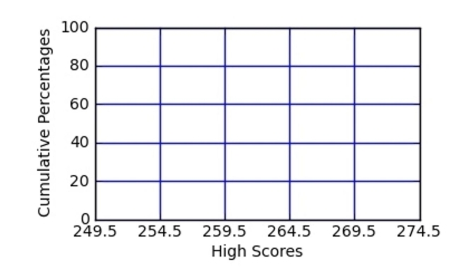
The data shown represents the high scores for members of a bowling league over a particular season. Find the approximate percentile rank of a score of 265 by constructing ; percentile graph.
Score Frequency 249.5-254.5 3 254.5-259.5 14 259.5-264.5 19 264.5-269.5 12 269.5-274.5 3
(Multiple Choice)
4.9/5 (40)
Find the mean for the following data set: 28 25 23 34 14 14
(Multiple Choice)
4.9/5 (42)
Find the sample standard deviation for the following data set: 25 13 31 33 20
(Multiple Choice)
4.9/5 (31)
Identify the five-number summary of the following data set. 7, 11, 21, 28, 32, 33, 37, 43.
(Multiple Choice)
4.9/5 (30)
A five-number summary of a data set consists of the minimum, , the median, , and the maximum.
(True/False)
4.8/5 (38)
Make a boxplot for the following data set.
24, 15, 34, 92, 68, 34, 78, 45, 53, 67, 83, 46
(Essay)
4.8/5 (34)
The number of police officers in selected city districts is listed below. Find the mode. 24, 26, 24, 30, 23, 28, 19, 31, 24, 26, 19
(Multiple Choice)
4.9/5 (31)
A consumer advocacy group tested the "on-air" lifetimes a random sample of 241 cell phone batteries. The mean lifetime was 3.2 hours with a standard deviation of 0.1 hours.
The lifetimes are approximately bell-shaped. Estimate the number of batteries with
Lifetimes between 3.0 hours and 3.4 hours.
(Multiple Choice)
4.9/5 (41)
Following are heights, in inches, for a sample of college basketball players.
84 88 86 85 70 75 72 86 78 81 86 78 81 72 73 76 77 87 88 84
Find the sample standard deviation for the heights of the basketball players.
(Multiple Choice)
4.9/5 (30)
For the data set below, find the upper outlier boundary. 154 160 146 146 131 148 164 199 169 139 165
(Multiple Choice)
4.7/5 (45)
Chebyshev's theorem can be used to find the minimum percentage of the values in a data
set that will fall within a certain distance of the mean.
(True/False)
4.8/5 (37)
A population has a mean and standard deviation . What number has a -score of
(Multiple Choice)
4.8/5 (30)
The percentile corresponding to a given data value is computed by adding the to number of values less than then dividing by the total number of values in the data set.
(True/False)
4.7/5 (36)
A student has an average of 78 on seven chapter tests. If the student's scores on six of the tests are 72, 82, 84, 66, 68, and 89, what was the score on the remaining test?
(Multiple Choice)
4.9/5 (40)
Filters
- Essay(0)
- Multiple Choice(0)
- Short Answer(0)
- True False(0)
- Matching(0)