Exam 2: Summarizing and Graphing Data
Exam 1: Introduction to Statistics85 Questions
Exam 2: Summarizing and Graphing Data82 Questions
Exam 3: Statistics for Describing, Exploring, and Comparing Data149 Questions
Exam 4: Probability170 Questions
Exam 5: Probability Distributions158 Questions
Exam 6: Normal Probability Distributions173 Questions
Exam 7: Estimates and Sample Sizes139 Questions
Exam 8: Hypothesis Testing130 Questions
Exam 9: Inferences From Two Samples105 Questions
Exam 10: Correlation and Regression129 Questions
Exam 11: Multinomial Experiments and Contingency Tables31 Questions
Exam 12: Analysis of Variance60 Questions
Exam 13: Nonparametric Statistics64 Questions
Exam 14: Statistical Process Control38 Questions
Select questions type
Find the original data from the stem-and-leaf plot.
- Stem Leaves 25 5094 26 112172 27 5094
(Multiple Choice)
4.8/5  (39)
(39)
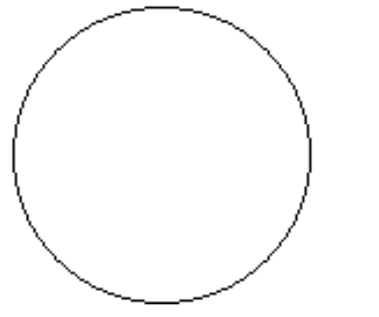
Use the circle graph to solve the problem.
-The pie chart below gives the number of students in the residence halls at the state university. 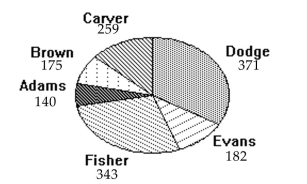 Which residence hall has the third highest number of students?
(Multiple Choice)
4.8/5 (42)
Solve the problem.
-At the National Criminologists Association's annual convention, participants filled out a questionnaire asking what they thought was the most important cause for criminal behavior. The tally was as follows. Cause Frequency education 19.5 drugs 58.5 family 39 poverty 68.25 other 9.75 Make a Pareto chart to display these findings.
(Multiple Choice)
4.8/5 (27)
Construct a boxplot for the given data. Include values of the 5-number summary in all boxplots.
-Using the information in the table on home sale prices in the city of Summerhill for the month of June, find the class boundaries for class 80.0-110.9. Class Limits Frequency (Sale price in thousands) (No. of homes sold) 80.0-110.9 2 111.0-141.9 5 142.0-172.9 7 173.0-203.9 10 204.0-234.9 3 235.0-265.9 1
(Multiple Choice)
4.8/5 (30)
Construct the relative frequency distribution that corresponds to the given frequency distribution.
- Days of vacation Frequency 0-1 19 2-3 20 4-5 16 6-7 22 8-9 23
(Multiple Choice)
4.9/5 (40)
Provide an appropriate response.
-Suppose that a data set has a minimum value of 28 and a max of 73 and that you want 5 classes. Explain how to find the class width for this frequency table. What happens if you mistakenly use a class width of 9 instead of 10?
(Short Answer)
4.8/5 (36)
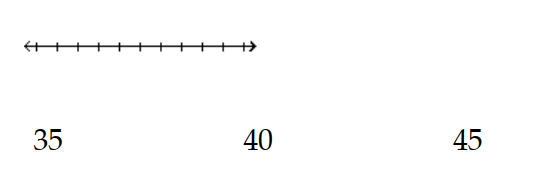
Construct the dot plot for the given data.
-The following data show the number of laps run by each participant in a marathon. 46 65 43 51 48 57 30 43 49 32 56
(Multiple Choice)
5.0/5 (40)
Construct the cumulative frequency distribution that corresponds to the given frequency distribution.
-A store manager counts the number of customers who make a purchase in his store each day. The data are as follows.
10 11 8 14 7 10 10 11 8 7
(Multiple Choice)
4.8/5 (28)
Construct the cumulative frequency distribution that corresponds to the given frequency distribution.
-Attendance records at a school show the number of days each student was absent during the year. The days absent for each student were as follows. 02 2 4 2 4 4 7 2 4 6
(Multiple Choice)
4.7/5 (31)
Construct the dot plot for the given data.
-The midterm test scores for the seventh-period typing class are listed below. 85 77 93 91 74 65 68 97 88 59 74 83 85 72 63 79
(Multiple Choice)
4.8/5 (39)
Provide an appropriate response.
-One purpose of displaying data graphically is to provide clues about trends. The given values are weights (ounces)of steaks listed on a restaurant menu as "20 ounce porterhouse" steaks. The weights are supposed to be 21 ounces because they supposedly lose an ounce when cooked. Create a frequency distribution with 5 classes. Based on your distribution, comment on the advertised "20 ounce" steaks. 17 20 21 18 20 20 20 18 19 19 20 19 21 20 18 20 20 19 18 19
(Essay)
4.7/5 (41)
Solve the problem.
-The following frequency distribution analyzes the scores on a math test. Find the indicated class midpoint or boundaries.
score Number of Students 40-59 2 60-75 4 76-82 6 83-94 15 95-99 5 The class boundaries of scores interval 40-59
(Multiple Choice)
4.9/5 (33)
Solve the problem.
-The frequency table below shows the amount of weight loss during the first month of a diet program for both males and females. Compare the results and determine whether there appears to be a significant difference between the two genders. Weight (lb) Frequency (males) Weight (lb) Frequency (females) 5-7 2 5-7 4 8-10 9 8-10 3 11-13 18 11-13 19 14-16 13 14-16 5 17-19 4 17-19 15 20-22 1 20-22 1
(Essay)
4.9/5 (38)
Construct the dot plot for the given data.
-The ages of the 45 members of a track and field team are listed below. Construct an expanded stemplot with about 8 rows. 21 18 42 35 32 21 44 25 38 48 14 19 23 22 28
32 34 27 31 17 16 41 37 22 24 33 32 21 26 30
22 27 32 30 20 18 17 21 15 26 36 31 40 16 25
(Multiple Choice)
4.9/5 (44)
Use the given data to construct a frequency distribution.
-On a math test, the scores of 24 students were 99 73 72 66 72 72 99 85 72 65 82 73 73 82 72 73 82 72 73 85 73 82 85 66
Score Frequency
(Essay)
4.7/5 (25)
Construct the cumulative frequency distribution that corresponds to the given frequency distribution.
-The following data represent the number of cars passing through a toll booth during a certain time period over a number of days. 38 39 37 37 44 38 41 38 39 35 42 39 43 37 41
(Multiple Choice)
4.8/5 (27)
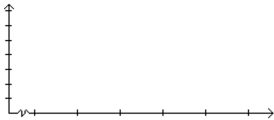
Solve the problem.
-In a survey, 20 people were asked how many magazines they had purchased during the previous year. The results are shown below. Construct a histogram to represent the data. Use 4 classes with a class width of 10, and begin with a lower class limit of -0.5. What is the approximate amount at the center? 6 15 3 36 25 18 12 18 5 30 24 7 0 22 33 24 19 4 12 9
(Essay)
4.8/5 (35)
Solve the problem.
-Consider the frequency distribution below, which has single values as classes: Value Frequency 10 1 11 3 12 7 13 18 14 10 15 4 16 2 17 7 18 16 19 10 20 6 21 2 Construct a new frequency distribution for this data with 4 classes. Now, construct another frequency distribution for this data with 6 classes. Suppose that you construct a histogram corresponding to the original data and histograms corresponding to each of the new frequency distributions. Describe the shapes of the three histograms. Does the histogram with six classes capture the distribution of the data? Does the histogram with four classes capture the distribution of the data?
(Essay)
4.8/5 (35)
Construct the relative frequency distribution that corresponds to the given frequency distribution.
- Speed Number of balls 0-29 4 30-59 16 60-89 60 90-120 20
(Multiple Choice)
4.9/5 (32)
Use the data to create a stemplot.
-After reviewing a movie, 800 people rated the movie as excellent, good, or fair. The following data give the rating distribution. Excellent Good Fair 160 400 240
(Multiple Choice)
4.9/5 (33)
Filters
- Essay(0)
- Multiple Choice(0)
- Short Answer(0)
- True False(0)
- Matching(0)