Exam 2: Summarizing and Graphing Data
Exam 1: Introduction to Statistics85 Questions
Exam 2: Summarizing and Graphing Data82 Questions
Exam 3: Statistics for Describing, Exploring, and Comparing Data149 Questions
Exam 4: Probability170 Questions
Exam 5: Probability Distributions158 Questions
Exam 6: Normal Probability Distributions173 Questions
Exam 7: Estimates and Sample Sizes139 Questions
Exam 8: Hypothesis Testing130 Questions
Exam 9: Inferences From Two Samples105 Questions
Exam 10: Correlation and Regression129 Questions
Exam 11: Multinomial Experiments and Contingency Tables31 Questions
Exam 12: Analysis of Variance60 Questions
Exam 13: Nonparametric Statistics64 Questions
Exam 14: Statistical Process Control38 Questions
Select questions type
Use the circle graph to solve the problem.
-The pie chart shows the percent of the total population of 54,400 of Springfield living in the given types of housing. Round your result to the nearest whole number. 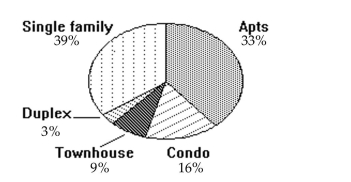 Find the number of people who live in townhouses.
(Multiple Choice)
4.9/5  (32)
(32)
Solve the problem.
-Suppose that a histogram is constructed for the frequency distribution shown below: Age Frequency 30-39 11 40-49 23 50-59 17 60-69 12 70-89 6 The class 60-69 has twice the frequency of the class 70-89. In the histogram, will the area of the bar for the class 60-69 be twice the area of the bar for the class 70-89? In other words, will areas be proportional to frequencies in this histogram? Explain your thinking. Are there any conditions under which areas are proportional to frequencies in histograms?
(Essay)
5.0/5 (36)
Construct the dot plot for the given data.
-Twenty-four workers were surveyed about how long it takes them to travel to work each day. The data below are given in minutes. 20 35 42 52 65 20 60 49 24 37 23 24 22 20 41 25 28 27 50 47 58 30 32 48
(Multiple Choice)
4.9/5 (36)
Construct the dot plot for the given data.
-The normal monthly precipitation (in inches)for August is listed for 39 different U.S. cities. Construct an expanded stemplot with about 9 rows. 3.5 1.6 2.4 3.7 4.1 3.9 1.0 3.6 1.7 0.4 3.2 4.2 4.1
4.2 3.4 3.7 2.2 1.5 4.2 3.4 2.7 4.0 2.0 0.8 3.6 3.7
0.4 3.7 2.0 3.6 3.8 1.2 4.0 3.1 0.5 3.9 0.1 3.5 3.4
(Multiple Choice)
4.9/5 (33)
Find the original data from the stem-and-leaf plot.
- Stem Leaves 7.7 18 7.8 88 7.9 188
(Multiple Choice)
4.9/5 (33)
Construct a pie chart representing the given data set.
-The following figures give the distribution of land (in acres)for a county containing 82,000 acres. Forest Farm Urban 12,300 8200 61,500

(Multiple Choice)
4.9/5 (34)
Use the data to create a stemplot.
-A car dealer is deciding what kinds of vehicles he should order from the factory. He looks at his sales report for the preceding period. Choose the vertical scale so that the relative frequencies are represented.
Vehicle Sales Economy 32 Sports 8 Family 56 Luxury 16 Truck 48 Construct a Pareto chart to help him decide.
(Multiple Choice)
4.8/5 (31)
Solve the problem.
-The following frequency distribution analyzes the scores on a math test. Find the indicated class midpoint or boundaries. score Number of Students 40-59 2 60-75 4 76-82 6 83-94 15 95-99 5 The class boundaries of scores interval 95-99
(Multiple Choice)
4.9/5 (32)
Construct a pie chart representing the given data set.
- x 1 -3 -3 -2 3 5 -1 8 -4 -1 y -4 -6 -7 2 3 3 -6 3 -3 -3
(Multiple Choice)
4.9/5 (40)
Solve the problem.
-The data shows the roundtrip mileage that 43 randomly selected professors and students drive to school each day. Compare the results and determine whether there appears to be any significant difference between the two groups. Score Frequency 10-14 2 15-19 5 20-24 13 25-29 17 30-34 6 Score Frequency 10-14 0 15-19 6 20-24 9 25-29 21 30-34 7
(Essay)
4.8/5 (33)
Construct the relative frequency distribution that corresponds to the given frequency distribution.
- Scores Frequency 91-100 5 81-90 5 71-80 7 61-70 8 <61 4
(Multiple Choice)
4.8/5 (34)
Solve the problem.
-Using the employment information in the table on Alpha Corporation, find the class midpoint for class 1-5. Years employed at Alpha Corporation Class Limits (years of service) Frequency (No. of employees) 1-5 5 6-10 20 11-15 25 16-20 10 21-25 5 26-30 3
(Multiple Choice)
4.7/5 (30)
Use the circle graph to solve the problem.
-The pie chart below gives the number of students in the residence halls at the state university. 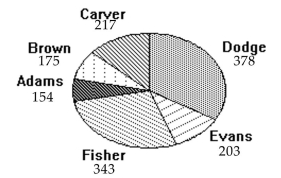 Write the ratio of the number of residents at Fisher to the number of students at Carver.
(Multiple Choice)
4.8/5 (36)
Use the circle graph to solve the problem.
-A survey of the 7095 vehicles on the campus of State University yielded the following pie chart. 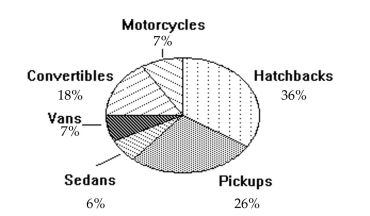 Find the number of pickups. Round your result to the nearest whole number.
(Multiple Choice)
4.8/5 (37)
Solve the problem.
-In a survey, 26 voters were asked their ages. The results are shown below. Construct a histogram to represent the data (with 5 classes beginning with a lower class limit of 19.5 and a class width of 10). What is the approximate age at the center? 43 56 28 63 67 66 52 48 37 51 40 60 62 66 45 21 35 49 32 53 61 53 69 31 48 59
(Essay)
4.9/5 (35)
Solve the problem.
-Use the high closing values of Naristar Inc. stock from the years 1992 - 2003 to construct a time-series graph. (Let x = 0 stand for 1992 and so on...)Identify a trend. Year High Year High 1992 48 1998 62 1993 53 1999 60 1994 47 2000 68 1995 55 2001 42 1996 58 2002 51 1997 61 2003 78
(Essay)
5.0/5 (31)
Use the given data to construct a frequency distribution.
-Kevin asked some of his friends how many hours they had worked during the previous week at their after-school jobs. The results are shown below. 6 6 6 3 6 6 9 8 6 3 8 6 6 8 6 6 8 6 6 8 6 8 8 3
Construct a frequency table. Use 4 classes, a class width of 2 hours, and a lower limit of 3 for class 1. Hours Frequency
(Essay)
4.8/5 (37)
Solve the problem.
-Construct a frequency distribution and the corresponding histogram in which the following conditions are satisfied: - The frequency for the second class is twice the frequency of the first class. - In the histogram, the area of the bar corresponding to the second class is four times the area of the bar corresponding to the first class.
(Essay)
4.8/5 (39)
Construct the relative frequency distribution that corresponds to the given frequency distribution.
- Weight (oz) Number of Stones 1.2-1.6 5 1.7-2.1 2 2.2-2.6 5 2.7-3.1 5 3.2-3.6 13
(Multiple Choice)
4.7/5 (41)
Provide an appropriate response.
-Sturges' guideline suggests that when constructing a frequency distribution, the ideal number of classes can be approximated by 1 + (log n)/(log 2), where n is the number of data values. Use this guideline to find the ideal number of classes when the number of data values is 122.
(Multiple Choice)
4.7/5 (21)
Filters
- Essay(0)
- Multiple Choice(0)
- Short Answer(0)
- True False(0)
- Matching(0)