Exam 14: Statistical Process Control
Exam 1: Introduction to Statistics85 Questions
Exam 2: Summarizing and Graphing Data82 Questions
Exam 3: Statistics for Describing, Exploring, and Comparing Data149 Questions
Exam 4: Probability170 Questions
Exam 5: Probability Distributions158 Questions
Exam 6: Normal Probability Distributions173 Questions
Exam 7: Estimates and Sample Sizes139 Questions
Exam 8: Hypothesis Testing130 Questions
Exam 9: Inferences From Two Samples105 Questions
Exam 10: Correlation and Regression129 Questions
Exam 11: Multinomial Experiments and Contingency Tables31 Questions
Exam 12: Analysis of Variance60 Questions
Exam 13: Nonparametric Statistics64 Questions
Exam 14: Statistical Process Control38 Questions
Select questions type
Use the given process data to construct a control chart for p
-A machine that is supposed to fill small bottles to contain 20 ml yields the following data from a test of 4 bottles every hour.
S A M R 1 19.9 20.1 20.2 20.3 20.125 0.4 2 20.4 20.0 20.3 20.3 20.25 0.4 3 20.0 20.7 20.4 20.3 20.35 0.7 4 20.4 20.1 20.1 19.9 20.125 0.5 5 19.9 19.8 19.6 19.5 19.7 0.4 6 19.4 19.4 19.6 19.7 19.525 0.3 7 19.8 19.4 19.6 19.7 19.625 0.4 8 19.9 19.8 20.0 20.0 19.925 0.2 9 20.2 20.3 20.1 20.3 20.225 0.2 10 20.0 20.3 20.0 20.2 20.125 0.3 11 20.3 20.5 20.1 20.2 20.275 0.4 12 20.1 19.9 19.8 19.7 19.875 0.4 13 19.5 19.8 19.7 19.6 1965 0.3 14 19.4 19.8 19.8 19.4 19.4 0.4 15 19.5 19.6 19.6 19.9 19.65 0.4

Free
(Essay)
4.9/5  (36)
(36)
Correct Answer: Verified
A machine that is supposed to fill small bottles to contain 20 ml yields the following data from a test of 4 bottles every hour.
S A M R 1 19.9 20.1 20.2 20.3 20.125 0.4 2 20.4 20.0 20.3 20.3 20.25 0.4 3 20.0 20.7 20.4 20.3 20.35 0.7 4 20.4 20.1 20.1 19.9 20.125 0.5 5 19.9 19.8 19.6 19.5 19.7 0.4 6 19.4 19.4 19.6 19.7 19.525 0.3 7 19.8 19.4 19.6 19.7 19.625 0.4 8 19.9 19.8 20.0 20.0 19.925 0.2 9 20.2 20.3 20.1 20.3 20.225 0.2 10 20.0 20.3 20.0 20.2 20.125 0.3 11 20.3 20.5 20.1 20.2 20.275 0.4 12 20.1 19.9 19.8 19.7 19.875 0.4 13 19.5 19.8 19.7 19.6 19.65 0.3 14 19.4 19.8 19.8 19.4 19.4 0.4 15 19.5 19.6 19.6 19.9 19.65 0.4
Free
(Essay)
4.7/5 (38)
Correct Answer:Verified
Solve the Problem.
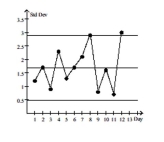
-A control chart for monitoring variation and center can be based on standard deviations instead of on ranges. An s chart for monitoring variation is made by plotting sample standard deviations with a center line at (the mean of the sample standard deviations) and control limits at and , where and are found in the Control Chart Constants table. Construct an s chart for the data below.
A manufacturer of lightbulbs picks 10 lightbulbs at random each day for quality control. The mean, standard de and range (in hours) of the lifetimes of the 10 lightbulbs are calculated. The results for 12 consecutive days are sh the table below.
Day Range s 1 201.1 3.4 1.2 2 203.4 4.7 1.7 3 200.9 3.1 0.9 4 205.6 6.2 2.3 5 201.3 4.7 1.3 6 200.5 3.7 1.7 7 205.8 5.8 2.1 8 203.7 6.2 2.9 9 199.8 2.1 0.8 10 202.7 4.4 1.6 11 200.0 2.7 0.7 12 204.6 7.8 3.0
Free
(Essay)
4.8/5 (38)
Correct Answer:Verified
Use the given process data to construct a control chart for p
-A machine is supposed to fill boxes to a weight of 50 lbs. Every 30 minutes a sample of four boxes is tested; the results are given below. S A M R 1 49 38 39 45 42.75 11 2 52 51 43 6 51.75 18 3 56 60 32 52 50 28 4 44 59 46 49 49.5 15 5 51 61 48 45 51.25 16 6 45 50 46 48 47.25 5 7 52 51 45 55 50.75 10 8 40 50 53 48 47.75 13 9 48 67 60 51 56.5 19 10 43 50 50 47 47.5 7 11 48 30 38 39 38.75 18 12 50 46 48 53 49.25 7 13 50 58 56 64 57 14 14 47 52 47 49 48.75 5 15 52 57 58 52 54.75 6
(Essay)
4.8/5 (33)
Use the given process data to construct a control chart for p
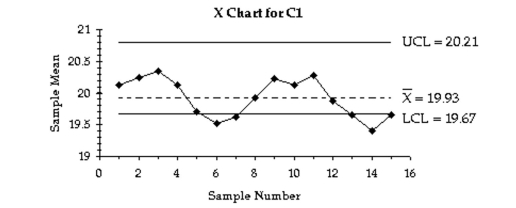
-A control chart fo s shown below. Determine whether the process mean is within statistical control. If it is not, identify which of the three out-of-control criteria lead to rejection of a statistically stable mean. 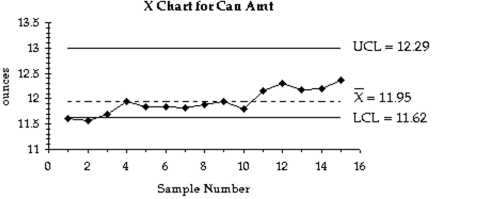
(Essay)
4.9/5 (37)
Use the given process data to construct a control chart for p
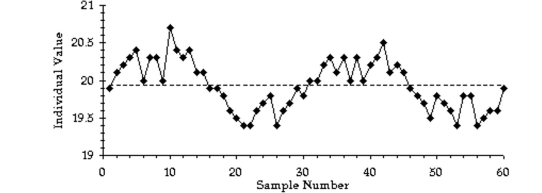
-A run chart for individual values is shown below. Does there appear to be a pattern suggesting that the process is not within statistical control? If so, describe the pattern. 
(Essay)
4.8/5 (47)
Solve the Problem.
-An chart based on standard deviations (instead of ranges) is made by plotting sample means with a centerline at and control limits at and where is found in the Control Chart Constants table and is the mean of the sample standard deviations. Construct an chart based on standard deviations for the data belo
A manufacturer of high intensity video projector lightbulbs picks 6 lightbulbs at random each day for quality cor The mean, standard deviation, and range (in hours) of the lifetimes of the 6 lightbulbs are calculated. The results consecutive days are shown in the table below.
Day Range s 1 21.13.4 1.2 2 23.44.7 1.7 3 20.93.1 0.9 4 25.66.2 2.3 5 21.3 4.7 1.3 6 20.5 3.7 1.7 7 25.85.8 2.1 8 23.76.2 2.9 9 29.82.1 0.8 10 22.7 4.4 1.6 11 20.02.7 0.7 12 24.67.8 3.0
(Essay)
4.8/5 (35)
Use the given process data to construct a control chart for p
-A machine is supposed to fill cans that contain 12 oz. Each hour, a sample of four cans is tested; the results of 15 consecutive hours are given below. 1 11.2 11.7 11.8 11.7 11.6 0.6 2 11.8 11.3 11.6 11.6 1.575 0.5 3 11.3 12.0 11.8 11.7 11.7 0.7 4 12.1 11.6 12.1 12.0 11.95 0.5 5 11.8 11.8 11.9 11.9 11.85 0.1 6 12.0 11.9 11.8 11.7 11.85 0.3 7 11.6 12.0 11.9 11.8 1.825 0.4 8 11.5 12.1 11.9 12.0 11.875 0.6 9 12.1 12.1 11.7 11.9 11.95 0.4 10 11.7 12.0 11.6 11.9 11.8 0.4 11 12.1 12.4 11.9 12.2 12.15 0.5 12 12.5 12.0 12.4 12.3 12.3 0.5 13 12.5 12.0 12.1 12.1 12.175 0.5 14 12.4 12.0 12.0 12.4 12.2 0.4 15 12.4 12.4 12.6 12.1 12.375 0.5
(Essay)
4.9/5 (33)
Use the given process data to construct a control chart for p
-A control chart for is shown below. Determine whether the process mean is within statistical control. If it is not, identify which of the three out-of-control criteria lead to rejection of a statistically stable mean. 
(Essay)
4.7/5 (31)
Solve the Problem.
-A control chart for attributes is to be constructed. Which process would have wider control limits, a process which has been having a 5% rate of nonconforming items, or a process which has been having a 10% of nonconforming items? Assume that both processes have the same sample sizes. For a given sample size, would it be easier to detect a shift from 5% to 10% or a shift from 10% to 15%? Explain your reasoning.
(Essay)
4.9/5 (33)
Use the given process data to construct a control chart for p
-Define statistically stable (or "within statistical control"). Show examples of run charts which illustrate processes which are not statistically controlled. Discuss the pattern which indicates the process is not statistically controlled for each example.
(Essay)
4.8/5 (37)
Use the given process data to construct a control chart for p
-A machine that is supposed to fill small bottles to contain 20 ml yields the following data from a test of 4 bottles every hour.
S A M R 1 19.9 20.1 20.2 20.3 20.125 0.4 2 20.4 20.0 20.3 20.3 20.25 0.4 3 20.0 20.7 20.4 20.3 20.35 0.7 4 20.4 20.1 20.1 19.9 20.125 0.5 5 19.9 19.8 19.6 19.5 19.7 0.4 6 19.4 19.4 19.6 19.7 19.525 0.3 7 19.8 19.4 19.6 19.7 19.625 0.4 8 19.9 19.8 20.0 20.0 19.925 0.2 9 20.2 20.3 20.1 20.3 20.225 0.2 10 20.0 20.3 20.0 20.2 20.125 0.3 11 20.3 20.5 20.1 20.2 20.275 0.4 12 20.1 19.9 19.8 19.7 19.875 0.4 13 19.5 19.8 19.7 19.6 19.65 0.3 14 19.4 19.8 19.8 19.4 19.4 0.4 15 19.5 19.6 19.6 19.9 19.65 0.4
(Essay)
4.8/5 (33)
Use the given process data to construct a control chart for p
-A run chart for individual values is shown below. Does there appear to be a pattern suggesting that the process is not within statistical control? If so, describe the pattern. 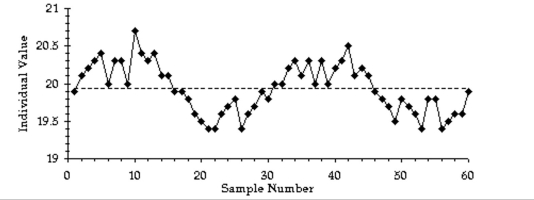
(Essay)
4.7/5 (30)
Use the given process data to construct a control chart for p
-Describe a control chart. Complete the table to identify the important parts of different types of control charts.
Center line and Upper Lower Points plotted how to compute control limit control limit Control char for R Control char for Control char for p
(Essay)
4.7/5 (31)
Use the given process data to construct a control chart for p
-If the weight of cereal in a particular packet is less than 14 oz, the packet is considered nonconforming. Each week, the manufacturer randomly selects 1,000 cereal packets and determines the number that are nonconforming. The results for 12 consecutive weeks are shown below. 46 32 21 30 47 31 32 52 48 45 62 58
(Essay)
4.7/5 (31)
Use the given process data to construct a control chart for p
-A common goal of quality control is to reduce variation in a product or service. List and describe the two types of variability. Give an example of each.
(Essay)
4.7/5 (37)
A machine is supposed to fill cans that contain 12 oz. Each hour, a sample of four cans is tested; the results of 15 consecutive hours are given below. S A M R 1 11.2 11.7 11.8 11.7 11.6 0.6 2 11.8 11.3 11.6 11.6 61.575 0.5 3 11.3 12.0 11.8 11.7 11.7 0.7 4 12.1 11.6 12.1 12.0 11.95 0.5 5 11.8 11.8 11.9 11.9 11.85 0.1 6 12.0 11.9 11.8 11.7 11.85 0.3 7 11.6 12.0 11.9 11.8 11.825 0.4 8 11.5 12.1 11.9 12.0 11.875 0.6 9 12.1 12.1 11.7 11.9 11.95 0.4 10 11.7 12.0 11.6 11.9 11.8 0.4 11 12.1 12.4 11.9 12.2 12.15 0.5 12 12.5 12.0 12.4 12.3 12.3 0.5 13 12.5 12.0 12.1 12.1 12.175 0.5 14 12.4 12.0 12.0 12.4 12.2 0.4 15 12.4 12.4 12.6 12 12.375 0.5
(Essay)
4.7/5 (33)
Use the given process data to construct a control chart for p
-Describe the three criteria used to determine if a control chart indicates a process which is not statistically stable.
(Essay)
4.7/5 (34)
Filters
- Essay(0)
- Multiple Choice(0)
- Short Answer(0)
- True False(0)
- Matching(0)