Exam 14: Statistical Process Control
Exam 1: Introduction to Statistics85 Questions
Exam 2: Summarizing and Graphing Data82 Questions
Exam 3: Statistics for Describing, Exploring, and Comparing Data149 Questions
Exam 4: Probability170 Questions
Exam 5: Probability Distributions158 Questions
Exam 6: Normal Probability Distributions173 Questions
Exam 7: Estimates and Sample Sizes139 Questions
Exam 8: Hypothesis Testing130 Questions
Exam 9: Inferences From Two Samples105 Questions
Exam 10: Correlation and Regression129 Questions
Exam 11: Multinomial Experiments and Contingency Tables31 Questions
Exam 12: Analysis of Variance60 Questions
Exam 13: Nonparametric Statistics64 Questions
Exam 14: Statistical Process Control38 Questions
Select questions type
Use the given process data to construct a control chart for p
-A machine that is supposed to produce ball bearings with a diameter of 7 mm yields the following data from a test of 5 ball bearings every 20 minutes.
S A M R 1 6.3 6.8 6.9 6.8 6.9 6.74 0.5 2 6.3 6.6 6.6 6.3 7.0 6.56 0.7 3 6.8 6.7 7.0 6.5 7.0 6.8 0.5 4 7.0 6.7 6.7 6.8 6.8 6.8 0.3 5 6.8 6.8 6.6 6.5 6.4 6.62 0.4 6 6.8 6.7 6.6 6.3 6.9 6.66 0.6 7 7.3 7.3 7.4 7.4 7.0 7.28 0.4 8 7.2 7.0 7.2 6.9 7.1 7.08 0.3 9 7.3 7.6 7.1 7.4 7.6 7.4 0.5 10 7.2 7.6 7.5 7.6 7.1 7.4 0.5 11 7.2 7.2 7.4 7.0 7.0 7.16 0.4 12 7.5 7.4 7.4 7.6 7.1 7.4 0.5
(Essay)
4.8/5  (38)
(38)
Use the given process data to construct a control chart for p
-Draw a control chart that illustrates a process which is statistically stable and one which illustrates a process which is not statistically stable. Discuss the results.
(Essay)
4.9/5 (40)
Use the given process data to construct a control chart for p
-A manufacturer monitors the level of defects in the television sets that it produces. Each week, 200 television sets are randomly selected and tested and the number of defects is recorded. The results for 12 consecutive weeks are shown below. 4 7 5 6 8 3 12 4 4 5 6 2
(Essay)
4.8/5 (34)
Use the given process data to construct a control chart for p
-A control chart for R is shown below. Determine whether the process variation is within statistical control. If it is not, identify which of the three out-of-control criteria lead to rejection of statistically stable variation. 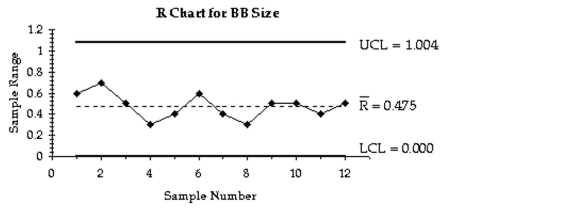
(Essay)
4.8/5 (39)
Use the given process data to construct a control chart for p
-A control chart for is shown below. Determine whether the process mean is within statistical control. If it is not, identify which of the three out-of-control criteria lead to rejection of a statistically stable mean. 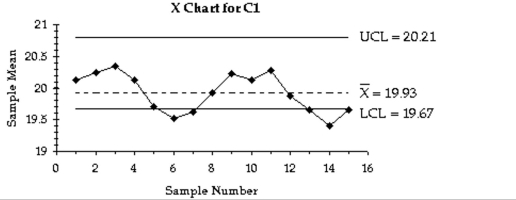
(Essay)
4.8/5 (36)
Use the given process data to construct a control chart for p
-Describe a run chart and give an example. Refer to the values on each of the axes as you describe the run chart.
(Essay)
4.8/5 (38)
Use the given process data to construct a control chart for p
-Relate the concept of control charts to the concept of confidence intervals.
(Essay)
4.8/5 (36)
Use the given process data to construct a control chart for p
- A control chart for is shown below. Determine whether the process mean is within statistical control. If it is not, identify which of the three out-of-control criteria lead to rejection of a statistically stable mean. 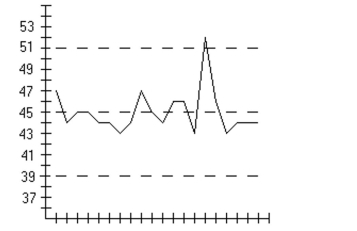
(Essay)
4.9/5 (36)
Use the given process data to construct a control chart for p
-A machine is supposed to fill boxes to a weight of 50 lbs. Every 30 minutes a sample of four boxes is tested; the results are given below.
S A M R 1 49 38 39 45 42.75 11 2 52 51 43 61 51.75 18 3 56 60 32 52 50 28 4 44 59 45 49 49.5 15 5 51 61 48 45 51.25 16 6 45 50 46 48 47.25 5 7 52 51 45 55 50.75 11 8 40 50 53 48 47.75 13 9 48 67 60 51 56.5 19 10 43 50 50 47 47.5 7 11 48 30 38 39 38.75 18 12 50 46 48 53 49.25 7 13 50 58 56 64 57 14 14 47 52 47 49 48.75 5 15 52 57 58 52 54.75 6
(Essay)
4.8/5 (32)
Use the given process data to construct a control chart for p
-A drugstore considers a wait of more than 5 minutes to be a defect. Each week 100 customers are randomly selected and timed at the checkout line. The numbers of defects for 20 consecutive weeks are given below. 4 4 5 5 5 5 5 5 6 6 6 6 12 6 6 6 7 6 7 8 7
(Essay)
4.9/5 (32)
Use the given process data to construct a control chart for p
-A control chart for R is shown below. Determine whether the process variation is within statistical control. If it is not, identify which of the three out-of-control criteria lead to rejection of statistically stable variation. 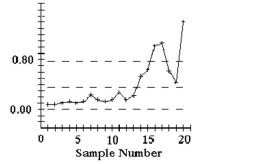
(Essay)
5.0/5 (37)
A machine is supposed to fill boxes to a weight of 50 lbs. Every 30 minutes a sample of four boxes is tested; the results are given below.
1 49 38 39 45 42.75 11 2 52 51 43 61 51.75 18 3 56 60 32 52 50 28 4 44 59 46 49 49.5 15 5 51 61 48 45 51.25 16 6 45 50 46 48 47.25 5 7 52 51 45 5 50.75 10 8 40 50 53 48 47.75 13 9 48 67 60 51 56.5 19 10 43 50 50 47 47.5 7 11 48 30 38 39 38.75 18 12 50 46 48 53 49.25 7 13 50 58 56 64 57 14 14 47 52 47 49 48.75 5 15 52 57 58 52 54.75 6
(Essay)
4.9/5 (32)
Use the given process data to construct a control chart for p
-A machine that is supposed to produce ball bearings with a diameter of 7 mm yields the following data from a test of 5 ball bearings every 20 minutes.
S A M R 1 6.3 6.8 6.9 6.8 6.9 6.74 0.6 2 6.3 6.6 6.6 6.3 7.0 6.56 0.7 3 6.8 6.7 7.0 6.5 7.0 6.8 0.5 4 7.0 6.7 6.7 6.8 6.8 6.8 0.3 5 6.8 6.8 6.6 6.5 6.4 6.62 0.4 6 6.8 6.7 6.6 6.3 6.9 6.66 0.6 7 7.3 7.3 7.4 7.4 7.0 7.28 0.4 8 7.2 7.0 7.2 6.9 7.1 7.08 0.3 9 7.3 7.6 7.1 7.4 7.6 7.4 0.5 10 7.2 7.6 7.5 7.6 7.1 7.4 0.5 11 7.2 7.2 7.4 7.0 7.0 7.16 0.4 12 7.5 7.4 7.4 7.6 7.1 7.4 0.5
(Essay)
4.7/5 (32)
Use the given process data to construct a control chart for p
-Describe what process data are. Why are process data important to businesses? What is a common goal of businesses using quality control?
(Essay)
4.9/5 (29)
Use the given process data to construct a control chart for p
-A machine is supposed to fill cans that contain 12 oz. Each hour, a sample of four cans is tested; the results of 15 consecutive hours are given below. S A M R 1 11.2 11.7 11.8 11.7 11.6 0.6 2 11.8 11.3 11.6 11.6 11.575 0.5 3 11.3 12.0 11.8 11.7 11.7 0.7 4 12.1 11.6 12.1 12.0 11.95 0.5 5 11.8 11.8 11.9 11.9 11.85 0.1 6 12.0 11.9 11.8 11.7 11.85 0.3 7 11.6 12.0 11.9 11.8 11.825 0.4 8 11.5 12.1 11.9 12.0 11.875 0.6 9 12.1 12.1 11.7 11.9 11.95 0.4 10 11.7 12.0 11.6 11.9 11.8 0.4 11 12.1 12.4 11.9 12.2 12.15 0.5 12 12.5 12.0 12.4 12.3 12.3 0.5 13 12.5 12.0 12.1 12.1 12.175 0.5 14 12.4 12.0 12.0 12.4 12.2 0.4 15 12.4 12.4 12.6 12.1 12.375 0.5
(Essay)
4.9/5 (38)
A machine that is supposed to produce ball bearings with a diameter of 7 mm yields the following data from a test of 5 ball bearings every 20 minutes. S A M R 1 6.3 6.8 6.9 6.8 6.9 6.74 0.6 2 6.3 6.6 6.6 6.3 7.0 6.56 0.7 3 6.8 6.7 7.0 6.5 7.0 6.8 0.5 4 7.0 6.7 6.7 6.8 6.8 6.8 0.3 5 6.8 6.8 6.6 6.5 6.4 6.62 0.4 6 6.8 6.7 6.6 6.3 6.9 6.66 0.6 7 7.3 7.3 7.4 7.4 7.0 7.28 0.4 8 7.2 7.0 7.2 6.9 7.1 7.08 0.3 9 7.3 7.6 7.1 7.4 7.6 7.4 0.5 10 7.2 7.6 7.5 7.6 7.1 7.4 0.5 11 7.2 7.2 7.4 7.0 7.0 7.16 0.4 12 7.5 7.4 7.4 7.6 7.1 7.4 0.5
(Essay)
4.8/5 (31)
Filters
- Essay(0)
- Multiple Choice(0)
- Short Answer(0)
- True False(0)
- Matching(0)