Exam 7: The Normal Probability Distribution
Exam 1: Data Collection118 Questions
Exam 2: Creating Tables and Drawing Pictures of Data77 Questions
Exam 3: Numerically Summarizing Data158 Questions
Exam 4: Describing the Relation Between Two Variables183 Questions
Exam 5: Probability266 Questions
Exam 6: Discrete Probability Distributions149 Questions
Exam 7: The Normal Probability Distribution123 Questions
Exam 8: Sampling Distributions46 Questions
Exam 9: Estimating the Value of a Parameter Using Confidence Intervals109 Questions
Exam 10: Hypothesis Tests Regarding a Parameter156 Questions
Exam 11: Inference on Two Samples125 Questions
Exam 12: Inference on Categorical Data39 Questions
Exam 13: Comparing Three or More Means51 Questions
Exam 14: Inference of the Least-Squares Regression Model and Multiple Regression82 Questions
Exam 15: Nonparametric Statistics74 Questions
Select questions type
Graph a Normal Curve
-Compare a graph of the normal density function with mean of 0 and standard deviation of 1 with a graph of a normal density function with mean equal to 4 and standard deviation of 1. The graphs would
(Multiple Choice)
4.8/5  (43)
(43)
State the Properties of the Normal Curve
-The area under a standard normal density curve with mean of 0 and standard deviation of 1 is
(Multiple Choice)
4.9/5 (38)
Explain the Role of Area in the Normal Density Function
-The analytic scores on a standardized aptitude test are known to be normally distributed with mean and standard deviation .
(a) Draw a normal curve with the parameters labeled.
(b) Shade the region that represents the proportion of test takers who scored less than 725 .
(c) Suppose the area under the normal curve to the left of is . Provide two interpretations of this result.
(Short Answer)
4.8/5 (41)
Use Normal Probability Plots to Assess Normality
-Determine whether the following normal probability plot indicates that the sample data could have come from a population that is normally distributed. 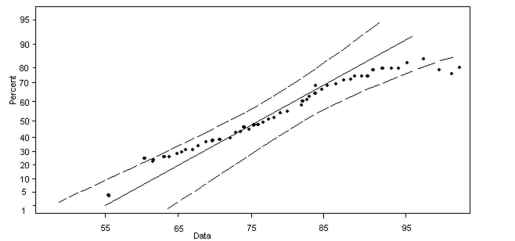
(Multiple Choice)
4.8/5 (34)
Find the Area under the Standard Normal Curve
-Find the area under the standard normal curve between and .
(Multiple Choice)
4.8/5 (30)
Find the Area under the Standard Normal Curve
-Given a distribution that follows a standard normal curve, what does the graph of the curve do as z increases in the positive direction?
(Multiple Choice)
4.9/5 (33)
Find the Value of a Normal Random Variable
-A new phone system was installed last year to help reduce the expense of personal calls that were being made by employees. Before the new system was installed, the amount being spent on personal calls follows a normal distribution with an average of $600 per month and a standard deviation of $50 per month. Refer to such expenses as PCE s (personal call expenses). Find the point in the distribution below which 2.5% of the PCE s fell.
(Multiple Choice)
4.8/5 (33)
Explain the Role of Area in the Normal Density Function
-The average mpg (miles per gallon) of a new model of motorcycle is known to be normally distributed with mean and standard deviation .
(a) Draw a normal curve with the parameters labeled.
(b) Shade the region that represents the proportion of mpgs between and .
(c) Suppose the area under the normal curve to between and is . Provide two interpretations of this result.
(Short Answer)
4.7/5 (32)
Approximate Binomial Probabilities Using the Normal Distribution
-For the following conditions, determine if it is appropriate to use the normal distribution to approximate a binomial distribution with and .
(Short Answer)
4.8/5 (37)
Find the Area under the Standard Normal Curve
-Find the sum of the areas under the standard normal curve to the left of and to the right of .
(Multiple Choice)
4.9/5 (39)
Interpret the Area under the Standard Normal Curve as a Probability
- and
(Multiple Choice)
4.7/5 (35)
Explain the Role of Area in the Normal Density Function
-The proportion of the population that has certain characteristics is the same as the probability that a randomly selected individual of the population has these same characteristics.
(True/False)
4.9/5 (37)
Approximate Binomial Probabilities Using the Normal Distribution
-Assuming that all conditions are met to approximate a binomial probability distribution with the standard normal distribution, then to compute from the binomial distribution we must compute _____as the normal approximation.
(Multiple Choice)
4.9/5 (38)
Interpret the Area under the Standard Normal Curve as a Probability
-Scores on a standardized test are normally distributed with a mean of 100 and a standard deviation of 12 . An individual's test score is found to be 125 . Find the -score corresponding to this value.
(Multiple Choice)
4.9/5 (30)
Find and Interpret the Area under a Normal Curve
-Suppose a brewery has a filling machine that fills 12 ounce bottles of beer. It is known that the amount of beer poured by this filling machine follows a normal distribution with a mean of 11.14 onces and a standard deviation of 0.04 ounce. Find the probability that the bottle contains more than 11.14 ounces of beer.
(Multiple Choice)
4.8/5 (35)
Interpret the Area under the Standard Normal Curve as a Probability
- and
(Multiple Choice)
4.7/5 (37)
Find and Interpret the Area under a Normal Curve
-A new phone system was installed last year to help reduce the expense of personal calls that were being made by employees. Before the new system was installed, the amount being spent on personal calls follows a normal distribution with an average of $700 per month and a standard deviation of $50 per month. Refer to such expenses as PCE s (personal call expenses). Find the probability that a randomly selected month had a PCE that falls below $550.
(Multiple Choice)
4.9/5 (33)
Find and Interpret the Area under a Normal Curve
-Suppose a brewery has a filling machine that fills 12 ounce bottles of beer. It is known that the amount of beer poured by this filling machine follows a normal distribution with a mean of 12.43 ounces and a standard deviation of 0.04 ounce. Find the probability that the bottle contains fewer than 12.33 ounces of beer.
(Multiple Choice)
4.8/5 (46)
State the Properties of the Normal Curve
-Approximately _____ of the area under the normal curve is between and .
(Multiple Choice)
4.8/5 (46)
Approximate Binomial Probabilities Using the Normal Distribution
-A salesperson found that there was a 1% chance of a sale from her phone solicitations. Find the probability of getting 5 or more sales for 1000 telephone calls.
(Multiple Choice)
4.9/5 (42)
Filters
- Essay(0)
- Multiple Choice(0)
- Short Answer(0)
- True False(0)
- Matching(0)