Exam 7: The Normal Probability Distribution
Exam 1: Data Collection118 Questions
Exam 2: Creating Tables and Drawing Pictures of Data77 Questions
Exam 3: Numerically Summarizing Data158 Questions
Exam 4: Describing the Relation Between Two Variables183 Questions
Exam 5: Probability266 Questions
Exam 6: Discrete Probability Distributions149 Questions
Exam 7: The Normal Probability Distribution123 Questions
Exam 8: Sampling Distributions46 Questions
Exam 9: Estimating the Value of a Parameter Using Confidence Intervals109 Questions
Exam 10: Hypothesis Tests Regarding a Parameter156 Questions
Exam 11: Inference on Two Samples125 Questions
Exam 12: Inference on Categorical Data39 Questions
Exam 13: Comparing Three or More Means51 Questions
Exam 14: Inference of the Least-Squares Regression Model and Multiple Regression82 Questions
Exam 15: Nonparametric Statistics74 Questions
Select questions type
Find the Value of a Normal Random Variable
-The board of examiners that administers the real estate broker s examination in a certain state found that the mean score on the test was 557 and the standard deviation was 72. If the board wants to set the passing score so that only the best 10% of all applicants pass, what is the passing score Assume that the scores are normally distributed.
(Short Answer)
4.7/5  (40)
(40)
Use Normal Probability Plots to Assess Normality
-Determine whether the following normal probability plot indicates that the sample data could have come from a population that is normally distributed. 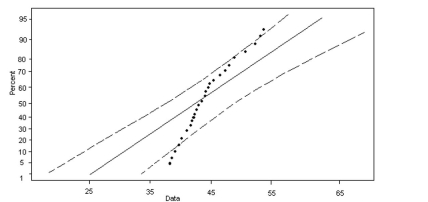
(Multiple Choice)
4.8/5 (36)
Approximate Binomial Probabilities Using the Normal Distribution
-A local rental car agency has 200 cars. The rental rate for the winter months is 60%. Find the probability that in a given winter month at least 140 cars will be rented. Use the normal distribution to approximate the binomial distribution.
(Short Answer)
4.7/5 (32)
Use Normal Probability Plots to Assess Normality
-An industrial psychologist conducted an experiment in which 40 employees that were identified as chronically tardy by their managers were divided into two groups of size 20. Group 1 participated in the new It s Great to be Awake! program, while Group 2 had their pay pay docked. The following data represent the number of minutes that employees in Group 1 were late for work after participating in the program. 119 127 142 146 142 158 143 178 133 136 148 124 133 148 153 154 154 155 126 148
(Multiple Choice)
4.8/5 (31)
Find and Interpret the Area under a Normal Curve
-between and if the standard deviation is .
(Multiple Choice)
4.9/5 (32)
Use Normal Probability Plots to Assess Normality
-Determine whether the following normal probability plot indicates that the sample data could have come from a population that is normally distributed. 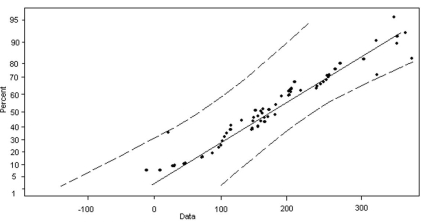
(Multiple Choice)
4.9/5 (41)
Approximate Binomial Probabilities Using the Normal Distribution
-Find the probability that in 200 tosses of a fair six-sided die, a three will be obtained at most 40 times.
(Multiple Choice)
4.7/5 (41)
A random variable X is normally distributed with = 60. Convert the value of X to a z-score, if the standard deviation is
as given.
-
(Multiple Choice)
4.8/5 (33)
Find and Interpret the Area under a Normal Curve
-A firm believes the internal rate of return for its proposed investment can best be described by a normal distribution with mean 36% and standard deviation 3%. What is the probability that the internal rate of return for the investment exceeds 42%
(Short Answer)
4.9/5 (41)
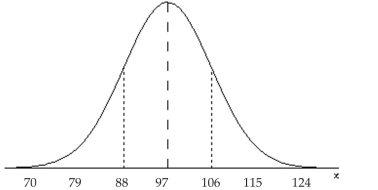
State the Properties of the Normal Curve
-The graph of a normal curve is given. Use the graph to identify the value of and .
(Multiple Choice)
4.9/5 (33)
Find and Interpret the Area under a Normal Curve
-The length of time it takes college students to find a parking spot in the library parking lot follows a normal distribution with a mean of 3.5 minutes and a standard deviation of 1 minute. Find the probability that a randomly selected college student will take between 2.0 and 4.5 minutes to find a parking spot in the library lot.
(Multiple Choice)
4.7/5 (32)
Find and Interpret the Area under a Normal Curve
-Suppose a brewery has a filling machine that fills 12 ounce bottles of beer. It is known that the amount of beer poured by this filling machine follows a normal distribution with a mean of 12.12 ounces and a standard deviation of 0.04 ounce. Find the probability that the bottle contains between 12.02 and 12.08 ounces.
(Multiple Choice)
4.8/5 (41)
Find and Interpret the Area under a Normal Curve
-The length of time it takes college students to find a parking spot in the library parking lot follows a normal distribution with a mean of 3.0 minutes and a standard deviation of 1 minute. Find the probability that a randomly selected college student will find a parking spot in the library parking lot in less than 2.5 minutes.
(Multiple Choice)
4.8/5 (35)
Approximate Binomial Probabilities Using the Normal Distribution
-The failure rate in a German class is 30%. In a class of 50 students, find the probability that exactly five students will fail. Use the normal distribution to approximate the binomial distribution.
(Short Answer)
4.9/5 (33)
Graph a Normal Curve
-You are performing a study about the weight of preschoolers. A previous study found the weights to be normally distributed with a mean of 30 and a standard deviation of 4. You randomly sample 30 preschool children and find their weights to be as follows. 25 25 26 26.5 27 27 27.5 28 28 28.5 29 29 30 30 30.5 31 31 32 32.5 32.5 33 33 34 34.5 35 35 37 37 38 38 a) Draw a histogram to display the data. Is it reasonable to assume that the weights are normally distributed Why b) Find the mean and standard deviation of your sample. c) Is there a high probability that the mean and standard deviation of your sample are consistent with those found in previous studies Explain your reasoning.
(Short Answer)
4.9/5 (52)
Find and Interpret the Area under a Normal Curve
-Use the standard normal distribution to find .
(Multiple Choice)
4.9/5 (37)
Approximate Binomial Probabilities Using the Normal Distribution
-A student answers all 48 questions on a multiple-choice test by guessing. Each question has four possible answers, only one of which is correct. Find the probability that the student gets exactly 15 correct answers. Use the normal distribution to approximate the binomial distribution.
(Multiple Choice)
4.9/5 (27)
Provide an appropriate response
-High temperatures in a certain city for the month of August follow a uniform distribution over the interval 64°F to 94°F. Find the high temperature which 90% of the August days exceed.
(Multiple Choice)
4.7/5 (37)
Interpret the Area under the Standard Normal Curve as a Probability
-
(Multiple Choice)
4.7/5 (43)
Explain the Role of Area in the Normal Density Function
-The area under the normal curve drawn with regard to the population parameters is the same as the proportion of the population that has these characteristics.
(True/False)
4.9/5 (48)
Filters
- Essay(0)
- Multiple Choice(0)
- Short Answer(0)
- True False(0)
- Matching(0)