Exam 3: Numerically Summarizing Data
Exam 1: Data Collection118 Questions
Exam 2: Creating Tables and Drawing Pictures of Data77 Questions
Exam 3: Numerically Summarizing Data158 Questions
Exam 4: Describing the Relation Between Two Variables183 Questions
Exam 5: Probability266 Questions
Exam 6: Discrete Probability Distributions149 Questions
Exam 7: The Normal Probability Distribution123 Questions
Exam 8: Sampling Distributions46 Questions
Exam 9: Estimating the Value of a Parameter Using Confidence Intervals109 Questions
Exam 10: Hypothesis Tests Regarding a Parameter156 Questions
Exam 11: Inference on Two Samples125 Questions
Exam 12: Inference on Categorical Data39 Questions
Exam 13: Comparing Three or More Means51 Questions
Exam 14: Inference of the Least-Squares Regression Model and Multiple Regression82 Questions
Exam 15: Nonparametric Statistics74 Questions
Select questions type
Choose the one alternative that best completes the statement or answers the question.
Provide an appropriate response.
-The percentage of measurements that are below the 88th percentile is
(Multiple Choice)
4.8/5  (34)
(34)
Draw and Interpret Boxplots
-A survey of 200 public universities indicated that the 25th percentile of the yearly tuition cost of the universities was $4500 and the 75th percentile was $7800. The minimum value was $2000, the median was $6000, and the maximum was $10,000. Use this information to construct a boxplot for the yearly tuition costs.
(Short Answer)
4.7/5 (37)
Determine the Mode of a Variable from Raw Data
-The ________ of a variable is computed by determining the sum of all the values of the variable in the data set and dividing this sum by the number of observations in the data set.
(Multiple Choice)
4.8/5 (42)
Provide an appropriate response.
-Variance is the square root of standard deviation.
(True/False)
4.8/5 (37)
Compute the Standard Deviation of a Variable from Raw Data
-The top speeds (in mph) for a sample of five new automobile brands are listed below. Calculate the standard deviation of the speeds.
(Multiple Choice)
4.8/5 (33)
Determine the Mode of a Variable from Raw Data
-The number of goals scored by a random sample of 16 hockey players for a given season are , , and 24. Compute the mean, median, and mode.
(Essay)
4.8/5 (42)
Use the Empirical Rule to Describe Data That Are Bell Shaped
-At a tennis tournament a statistician keeps track of every serve. The statistician reported that the mean serve speed of a particular player was 103 miles per hour (mph) and the standard deviation of the serve speeds was 9 mph. Assume that the statistician also gave us the information that the distribution of the serve speeds was bell shaped. What proportion of the player s serves are expected to be between 112 mph and 130 mph
(Multiple Choice)
4.8/5 (30)
If are the observations of a variable from a population, then the population mean is symbolized by
(Multiple Choice)
4.7/5 (37)
Approximate the Variance and Standard Deviation of a Variable from Grouped Data
-For the following data set, approximate the sample standard deviation of monthly telephone bills (in dollars).
(Multiple Choice)
4.8/5 (35)
Determine the Mode of a Variable from Raw Data
-In a sample of 18 students at East High School the following number of days of absences were recorded for the previous semester: . Compute the mean, median, and mode.
(Essay)
4.9/5 (31)
Determine and Interpret z-Scores
-A severe drought affected several western states for 3 years. A Christmas tree farmer is worried about the drought s effect on the size of his trees. To decide whether the growth of the trees has been retarded, the farmer decides to take a sample of the heights of 25 trees and obtains the following results (recorded in inches): 60 57 62 69 46 54 64 60 59 58 75 51 49
60 57 62 69 46 54 64 60 59 58 75 51 67 65 44 58 55 48 62 63 73 52 55 50
67 65 44 58 55 48 62 63 73 52 55 50 The tree farmer feels the normal height of a tree that was unaffected by the drought would be 65 inches. Find the z-score for a tree that is 65 inches tall.
(Multiple Choice)
4.9/5 (32)
Provide an appropriate response.
-For the following data, approximate the mean number of emails received per day. 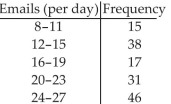
(Multiple Choice)
4.7/5 (33)
Determine the Median of a Variable from Raw Data
-The median of a data set for a variable is the data value that
(Multiple Choice)
4.9/5 (33)
Determine the Mode of a Variable from Raw Data
-Which measure of central tendency is not resistant to extreme values in a numeric data set
(Multiple Choice)
4.9/5 (38)
Filters
- Essay(0)
- Multiple Choice(0)
- Short Answer(0)
- True False(0)
- Matching(0)