Exam 3: Numerically Summarizing Data
Exam 1: Data Collection118 Questions
Exam 2: Creating Tables and Drawing Pictures of Data77 Questions
Exam 3: Numerically Summarizing Data158 Questions
Exam 4: Describing the Relation Between Two Variables183 Questions
Exam 5: Probability266 Questions
Exam 6: Discrete Probability Distributions149 Questions
Exam 7: The Normal Probability Distribution123 Questions
Exam 8: Sampling Distributions46 Questions
Exam 9: Estimating the Value of a Parameter Using Confidence Intervals109 Questions
Exam 10: Hypothesis Tests Regarding a Parameter156 Questions
Exam 11: Inference on Two Samples125 Questions
Exam 12: Inference on Categorical Data39 Questions
Exam 13: Comparing Three or More Means51 Questions
Exam 14: Inference of the Least-Squares Regression Model and Multiple Regression82 Questions
Exam 15: Nonparametric Statistics74 Questions
Select questions type
Determine the Mode of a Variable from Raw Data
-Which measure of central tendency may have more than one value in a numeric data set
(Multiple Choice)
4.8/5  (27)
(27)
Determine and Interpret z-Scores
-A highly selective boarding school will only admit students who place at least 1.5 z-scores above the mean on a standardized test that has a mean of 110 and a standard deviation of 12. What is the minimum score that an applicant must make on the test to be accepted
(Multiple Choice)
4.8/5 (39)
Provide an appropriate response.
-The grades are given for a student for a particular term. Find the grade point average. The point values of grades are given below.
D: F: 0
Grade Credit Hours A 4 D 1 A 3 C 2 D 4
(Multiple Choice)
4.7/5 (32)
Provide an appropriate response.
-For the following data, approximate the mean number of unused vacation days at the end of the year.
Days Frequency 1-2 1 3-4 22 5-6 3 7-8 18 9-10 2
(Multiple Choice)
4.9/5 (40)
Draw and Interpret Boxplots
-SAS was used to compare the high school dropout rates for the 50 states in 1982 and 1984. The box plots generated for these dropout rates are shown below. Compare the center of the distributions and the variation of the distributions for the two years. 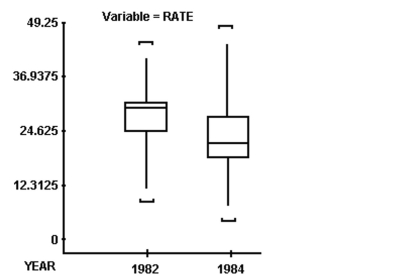
(Multiple Choice)
4.9/5 (41)
Compute the Standard Deviation of a Variable from Raw Data
-Last year batting averages in professional baseball averaged 0.261 with a high of 0.333 and a low of 0.224 (minimum 250 at-bats). Based on this information, which measure of variation could be calculated
(Multiple Choice)
4.8/5 (27)
Use the Empirical Rule to Describe Data That Are Bell Shaped
-The scores from a state standardized test have a bell-shaped distribution with a mean of 100 and a standard deviation of 15. Use the Empirical Rule to find the percentage of students with scores between 70 and
(Multiple Choice)
4.8/5 (36)
Provide an appropriate response.
-If the graph of a distribution of data shows that the graph is skewed to the left then the
(Multiple Choice)
4.8/5 (33)
Provide an appropriate response.
-Describe the shape of the histogram. The data set: round-trip commuting times (in minutes) of 20 randomly selected employees 135 120 115 132 136 124 119 145 98 110
125 120 115 130 140 105 116 121 125 108
(Multiple Choice)
4.7/5 (39)
Provide an appropriate response.
-A random sample of sale prices of homes yielded the following summary information: MIN \ 42,000 25\%:\ 81,000 Median: \ 138,000 MAX \ 271,000 75\%:\ 169,000 Comment on a home that had a sale price of $415,000.
(Multiple Choice)
4.7/5 (41)
The heights of ten female students (in inches) in a college math class are listed below. Find the mean. 65 66 67 66 67 70 67 70 71 68
(Multiple Choice)
4.9/5 (25)
Provide an appropriate response.
-A severe drought affected several western states for 3 years. A Christmas tree farmer is worried about the drought s effect on the size of his trees. To decide whether the growth of the trees has been retarded, the farmer decides to take a sample of the heights of 25 trees and obtains the following results (recorded in inches): 60 57 62 69 46 54 64 60 59 58 75 51 49
67 65 44 58 55 48 62 63 73 52 55 50 Which measure of central tendency would be considered the best measure to use in this problem
(Multiple Choice)
4.9/5 (32)
Provide an appropriate response.
-If the graph of a distribution of data shows that the graph is skewed to the right then the
(Multiple Choice)
4.8/5 (36)
Use the Empirical Rule to Describe Data That Are Bell Shaped
-A study was designed to investigate the effects of two variables - (1) a student's level of mathematical anxiety and (2) teaching method - on a student's achievement in a mathematics course. Students who had a low level of mathematical anxiety were taught using the traditional expository method. These students obtained a mean score of 430 with a standard deviation of 50 on a standardized test. Assuming a bell-shaped distribution, what percentage of scores exceeded 330 ?
(Multiple Choice)
4.7/5 (37)
Determine the Median of a Variable from Raw Data
-The number of students enrolled in a physics class for the last ten semesters are listed below. Find the median number of students. 65 66 67 66 67 70 67 70 71 68
(Multiple Choice)
4.8/5 (35)
Compute the Standard Deviation of a Variable from Raw Data
-81, 75, 44, 63, 42, 30, 64, 76, 88
(Multiple Choice)
4.8/5 (34)
Compute the Range of a Variable from Raw Data
-The January utility bills (in dollars) for 20 residents of a large city are listed below. Find the range of the data.
70 72 71 70 69 73 69 68 70 71
67 71 70 74 69 68 71 71 71 72
(Multiple Choice)
4.9/5 (32)
Determine the Median of a Variable from Raw Data
-The number of homework points earned by twelve students in a history class over one term are listed below. Find the mean and median number of points. Round the mean to the nearest whole number. Which measure of central tendency- the mean or the median- best represents the data Explain your reasoning. 102 56 25 9 9 56 165 88 122 150 91 114
(Short Answer)
4.9/5 (37)
Filters
- Essay(0)
- Multiple Choice(0)
- Short Answer(0)
- True False(0)
- Matching(0)