Exam 3: Numerically Summarizing Data
Exam 1: Data Collection118 Questions
Exam 2: Creating Tables and Drawing Pictures of Data77 Questions
Exam 3: Numerically Summarizing Data158 Questions
Exam 4: Describing the Relation Between Two Variables183 Questions
Exam 5: Probability266 Questions
Exam 6: Discrete Probability Distributions149 Questions
Exam 7: The Normal Probability Distribution123 Questions
Exam 8: Sampling Distributions46 Questions
Exam 9: Estimating the Value of a Parameter Using Confidence Intervals109 Questions
Exam 10: Hypothesis Tests Regarding a Parameter156 Questions
Exam 11: Inference on Two Samples125 Questions
Exam 12: Inference on Categorical Data39 Questions
Exam 13: Comparing Three or More Means51 Questions
Exam 14: Inference of the Least-Squares Regression Model and Multiple Regression82 Questions
Exam 15: Nonparametric Statistics74 Questions
Select questions type
Provide an appropriate response.
-A 1-pound bag of peanuts contains 430 peanuts. The distribution of weights in grams of the peanuts is given below . What is the mean weight of a peanut Weights (grams) Frequency 0.755-0.814 3 0.815-0.874 2 0.875-0.934 2 0.935-0.994 2 0.995-1.054 168 1.055-1.114 241 1.115-1.174 12
(Multiple Choice)
4.9/5  (36)
(36)
Provide an appropriate response.
-In a health food store, Jenny and Kevin create a trail mix from dried fruit, nuts, and granola. They buy 3 pounds of dried fruit at per pound, 2 pounds of nuts at per pound, and 5 pounds of granola at per pound. Determine the cost per pound of the mix.
(Multiple Choice)
4.9/5 (46)
Provide an appropriate response.
-Each year advertisers spend billions of dollars purchasing commercial time on network sports television. In the first 6 months of 1988, advertisers spent $1.1 billion. Who were the largest spenders In a recent article, listed the top 10 leading spenders (in million of dollars): Company A \ 71.1 Company F \ 27.7 Company B 63.6 Company G 24.3 Company C 57.7 Company H 21 Company D 55.3 Company I 21.1 Company E 29.2 Company J 19.4 Calculate the sample variance.
(Multiple Choice)
4.8/5 (35)
Compute the Standard Deviation of a Variable from Raw Data
-Which is not a measure of dispersion
(Multiple Choice)
4.9/5 (39)
Draw and Interpret Boxplots
-The boxplot shown below was constructed in Excel for the amount of soda that was poured by a filling machine into 12-ounce soda cans at a local bottling company. 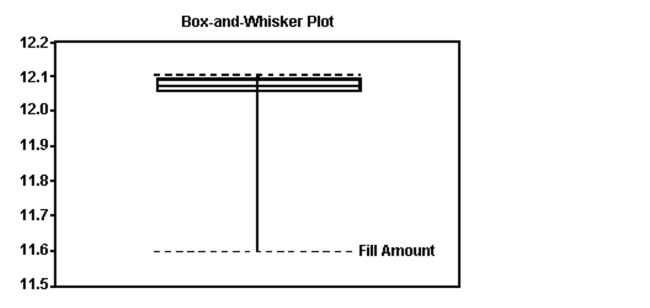 Based on the information given in the boxplot below, what shape do you believe the data to have
(Multiple Choice)
4.8/5 (38)
Use the Empirical Rule to Describe Data That Are Bell Shaped
-A study was designed to investigate the effects of two variables - (1) a student's level of mathematical anxiety and (2) teaching method - on a student's achievement in a mathematics course. Students who had a low level of mathematical anxiety were taught using the traditional expository method. These students obtained a mean score of 490 with a standard deviation of 20 on a standardized test. Assuming a bell-shaped distribution, where would approximately of the students score?
(Multiple Choice)
4.9/5 (37)
Determine and Interpret z-Scores
-A television station claims that the amount of advertising per hour of broadcast time has an average of 17 minutes and a standard deviation equal to 2.2 minutes. You watch the station for 1 hour, at a randomly selected time, and carefully observe that the amount of advertising time is equal to 7 minutes. Calculate the z-score for this amount of advertising time.
(Multiple Choice)
4.8/5 (34)
Use the Empirical Rule to Describe Data That Are Bell Shaped
-A small computing center has found that the number of jobs submitted per day to its computers has a distribution that is approximately bell shaped, with a mean of 91 jobs and a standard deviation of 12 . Where do we expect most (approximately ) of the distribution to fall?
(Multiple Choice)
4.9/5 (37)
Use Chebyshev s Inequality to Describe Any Set of Data
-A study was designed to investigate the effects of two variables - (1) a student s level of mathematical anxiety and (2) teaching method - on a student s achievement in a mathematics course. Students who had a low level of mathematical anxiety were taught using the traditional expository method. These students obtained a mean score of 350 with a standard deviation of 20 on a standardized test. Assuming no information concerning the shape of the distribution is known, what percentage of the students scored between 310 and 390
(Multiple Choice)
4.8/5 (32)
Determine and Interpret z-Scores
-Find the z-score for the value 83, when the mean is 59 and the standard deviation is 6.
(Multiple Choice)
4.8/5 (33)
Provide an appropriate response.
-The monthly telephone usage (in minutes) of 30 adults is listed below. Find the interquartile range for the telephone usage of the 30 adults. 154 156 165 165 170 171 172 180 184 185 189 189 190 192 195 198 198 200 200 200 205 205 211 215 220 220 225 238 255 265
(Multiple Choice)
4.7/5 (32)
Provide an appropriate response.
-The selling prices of mutual funds change daily. In order to study these changes, a sample of mutual funds was examined and the daily changes in price are listed below.
Determine the lower and upper fences. Are there any outliers according this criterion?
(Essay)
4.8/5 (38)
Approximate the Variance and Standard Deviation of a Variable from Grouped Data
-For the following data set, approximate the sample standard deviation of commuting times per day. Commute (in min) Frequency 50-52 5 53-55 8 56-58 12 59-61 13 62-64 11
(Multiple Choice)
4.7/5 (32)
Determine the Median of a Variable from Raw Data
-The annual profits of ten internet businesses are listed below. Find the mean and median profits. Round the median to the nearest dollar. Which measure- the mean or the median- best represents the data Explain your reasoning. \ 1,172,246 \ 163,659 \ 440,584 \ 350,634 \ 290,596 \ 186,731 \ 145,809 \ 143,209 \ 139,096 \ 125,106
(Essay)
4.7/5 (39)
Compute the Standard Deviation of a Variable from Raw Data
-
(Multiple Choice)
4.8/5 (40)
Compute the Standard Deviation of a Variable from Raw Data
-The _______________ is the easiest measure of dispersion to calculate.
(Multiple Choice)
4.9/5 (30)
Determine and Interpret z-Scores
-A student scores 74 on a geography test and 243 on a mathematics test. The geography test has a mean of 80 and a standard deviation of 5. The mathematics test has a mean of 300 and a standard deviation of 38. If the data for both tests are normally distributed, on which test did the student score better relative to the other students in each class
(Multiple Choice)
4.9/5 (33)
Determine the Median of a Variable from Raw Data
-Each year advertisers spend billions of dollars purchasing commercial time on network sports television. In the first 6 months of 1988, advertisers spent $1.1 billion. A recent article listed the top 10 leading spenders (in millions of dollars): Company A \ 72.2 Company F \ 26.1 Company B 63.5 Company G 25.7 Company C 55.7 Company H 21.3 Company D 54.5 Company I 23.9 Company E 30.1 Company J 19
Calculate the median.
(Multiple Choice)
4.8/5 (37)
Use the Empirical Rule to Describe Data That Are Bell Shaped
-A severe drought affected several western states for 3 years. A Christmas tree farmer is worried about the drought's effect on the size of his trees. To decide whether the growth of the trees has been retarded, the farmer decides to take a sample of the heights of 25 trees. Typically trees of this age have a mean height of 65 inches with a standard deviation of 9 inches. Assuming the distribution is bell shaped, where do you expect middle of the tree heights to fall?
(Multiple Choice)
4.8/5 (35)
Determine the Mode of a Variable from Raw Data
-Which measure of central tendency may not exist for all numeric data sets
(Multiple Choice)
4.8/5 (32)
Filters
- Essay(0)
- Multiple Choice(0)
- Short Answer(0)
- True False(0)
- Matching(0)