Exam 3: Exponential and Logarithmic Functions
Exam 1: Functions and Their Graphs120 Questions
Exam 2: Polynomial and Rational Functions120 Questions
Exam 3: Exponential and Logarithmic Functions120 Questions
Exam 4: Trigonometric Functions120 Questions
Exam 5: Analytic Trigonometry120 Questions
Exam 6: Additional Topics in Trigonometry120 Questions
Exam 7: Linear Systems and Matrices120 Questions
Exam 8: Sequences, Series, and Probability118 Questions
Exam 9: Topics in Analytic Geometry120 Questions
Exam 10: Analytic Geometry in Three Dimensions120 Questions
Exam 11: Limits and an Introduction to Calculus120 Questions
Select questions type
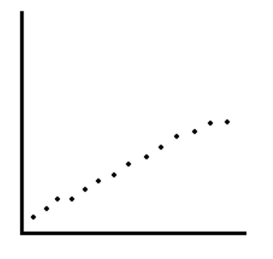
Determine whether the scatter plot below could best be modeled by a linear model, a quadratic model, an exponential model, a logarithmic model, or a logistic model.
(Multiple Choice)
4.9/5  (43)
(43)
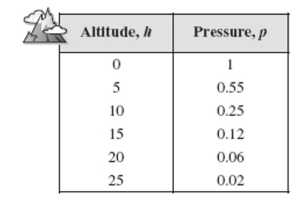
The atmospheric pressure decreases with increasing altitude. At sea level, the average air pressure is approximately kilograms per square centimeter, and this pressure is called one atmosphere. Variations in weather conditions cause changes in the atmospheric pressure of up to percent. The table below shows the pressures (in atmospheres) for various altitudes (in kilometers). Use the regression feature of a graphing utility to find the logarithmic model for the data. Use the model to estimate the altitude at which the pressure is atmosphere. Round your answer to two decimal places.
(Multiple Choice)
4.9/5 (27)
Evaluate the logarithm using the change of base formula. Round to 3 decimal places.
(Multiple Choice)
4.7/5 (34)
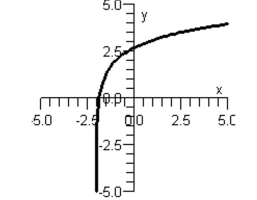
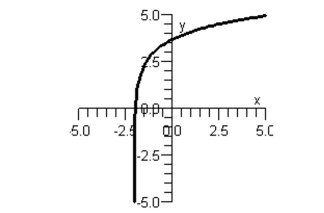
Match the function with its graph.
Graph I:
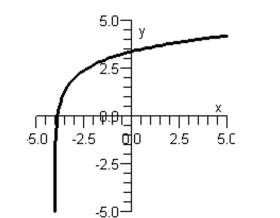 Graph II:
 Graph III:
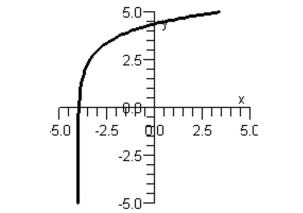 Graph IV:
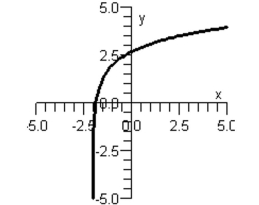 Graph V:
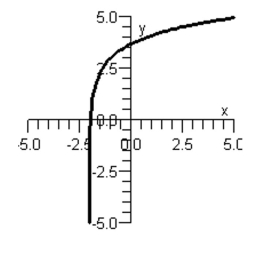
(Multiple Choice)
4.9/5 (38)
A conservation organization releases 100 animals of an endangered species into a game preserve. The organization believes that the preserve has a carrying capacity of 900 animals and that the growth of the herd will follow the logistic curve , where is measured in months. What is the population after 8 months? Round your answer to the nearest animal.
(Multiple Choice)
4.9/5 (43)
Condense the expression below to the logarithm of a single quantity.
(Multiple Choice)
4.8/5 (33)
Solve the logarithmic equation below algebraically. Round your result to three decimal places.
(Multiple Choice)
4.8/5 (40)
Solve the logarithmic equation below algebraically. Round your result to three decimal places.
(Multiple Choice)
4.8/5 (32)
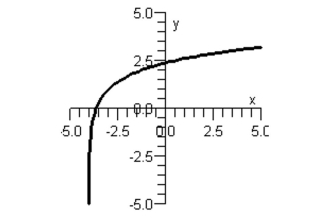
Match the function with its graph.
Graph I:
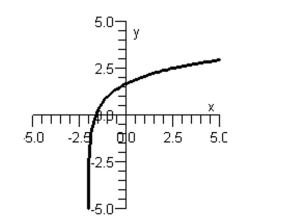 Graph II:
 Graph III:
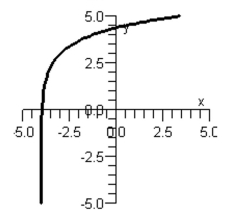 Graph IV:
 Graph V:
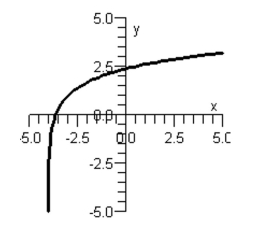
(Multiple Choice)
4.7/5 (39)
Filters
- Essay(0)
- Multiple Choice(0)
- Short Answer(0)
- True False(0)
- Matching(0)