Exam 4: Summarizing Bivariate Data
Exam 1: Basic Ideas39 Questions
Exam 2: Graphical Summaries of Data40 Questions
Exam 3: Numerical Summaries of Data76 Questions
Exam 4: Summarizing Bivariate Data33 Questions
Exam 5: Probability99 Questions
Exam 6: Discrete Probability Distributions76 Questions
Exam 7: The Normal Distribution131 Questions
Exam 8: Confidence Intervals62 Questions
Exam 9: Hypothesis Testing115 Questions
Exam 10: Two-Sample Confidence Intervals44 Questions
Exam 11: Two-Sample Hypothesis Tests43 Questions
Exam 12: Tests With Qualitative Data26 Questions
Exam 13: Inference in Linear Models51 Questions
Exam 14: Analysis of Variance48 Questions
Exam 15: Nonparametric Statistics27 Questions
Select questions type
The following display from a graphing calculator presents the least-squares regression line for predicting the price of a certain commodity (y) from the price of a barrel of oil (x). 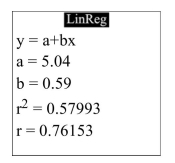 What is the correlation between the oil price and the commodity price?
(Multiple Choice)
4.7/5  (49)
(49)
The following MINITAB output presents the lest squares regression line for predicting the price of a certain commodity from the price of a barrel of oil. The regression equation is
Predictor Coef SE Coef T P Constant -43.987621 87.188705 -0.504511 0.640428 Oil 23.368407 0.872214 2.715396 0.05324
Predict the commodity price when the oil price is $114 per barrel.
(Multiple Choice)
4.9/5 (47)
The common cricket can be used as a crude thermometer. The colder the temperature, the slower the rate of chirping. The table below shows the average chirp rate of a cricket at various temperatures.
Chirp Rate (chirps/second) Temperature 2.8 70.5 1.7 54.7 3.3 71.6 2.7 69 2.3 54.1 3.4 73.1
The least-squares regression line for predicting the temperature from the chirp rate is y = 32.298 + 12.297x.If two chirp rates differ by 1.5 chirps per second, by how much would the temperature differ?
(Multiple Choice)
4.8/5 (37)
One of the primary feeds for beef cattle is corn. The following table presents the average price in dollars for a bushel of corn and a pound of ribeye steak for 10 consecutive months. Corn Price (\ /bu) Ribeye Price (\ /lb) 6.09 12.59 6.45 13.23 6.32 13.62 6.25 12.89 6.33 13.22 6.53 14.10 Compute the least-squares regression line for predicting the ribeye price from the corn price.
(Multiple Choice)
4.9/5 (35)
The common cricket can be used as a crude thermometer. The colder the temperature, the slower the rate of chirping. The table below shows the average chirp rate of a cricket at various temperatures. Chirp Rate (chirps/second) Temperature 3.7 67.8 2.6 64.6 1.9 55.1 1.8 44.3 3.9 71 2.8 67.8
Compute the least-squares regression line for predicting the temperature from the chirp rate.
(Multiple Choice)
4.8/5 (45)
One of the primary feeds for beef cattle is corn. The following table presents the average price in dollars for a bushel of corn and a pound of ribeye steak for 10 consecutive months.
Corn Price ( \/ bu) Ribeye Price (\ /) 6.25 13.57 5.81 12.99 5.79 13.01 6.64 13.70 6.24 13.54 6.03 12.71 5.99 12.47 6.28 13.50 6.33 13.02 5.87 12.40
Compute the correlation coefficient between the corn price and the ribeye price.
(Multiple Choice)
4.8/5 (35)
Compute the correlation coefficient. x 5 6 7 8 9 10 y 108 102 113 116 153 149
(Multiple Choice)
4.8/5 (39)
One of the primary feeds for beef cattle is corn. The following table presents the average price in dollars for a bushel of corn and a pound of ribeye steak for 10 consecutive months.
Corn Price ( \/ bu) Ribeye Price (\ /) 5.89 12.94 6.66 14.20 6.07 13.05 5.72 12.86 6.20 13.61 6.42 13.24 5.81 12.98 6.68 13.45 5.75 12.13 5.90 12.79
Construct a scatter plot of the price of ribeye (y) versus the price of corn (x).
(Multiple Choice)
4.8/5 (37)
MINITAB-style residual plots are shown below. Which one of these plots indicates that it was appropriate to compute a least-squares regression line?
(Multiple Choice)
4.7/5 (34)
One of the primary feeds for beef cattle is corn. The following table presents the average price in dollars for a bushel of corn and a pound of ribeye steak for 10 consecutive months. Corn Price ( \/ bu) Ribeye Price ( \/ lb) 5.97 12.20 6.37 12.86 5.92 12.51 5.91 12.28 5.79 12.67 6.35 13.13 The least-squares regression line for predicting the ribeye price from the corn price is y = 6.3662 + 1.0315x.
If the price of corn differs by $0.15 per bushel, by how much would you expect the price of ribeye to Differ?
(Multiple Choice)
4.8/5 (37)
For the following data set, how much of the variation in the outcome variable is explained by the least-squares regression line?
x 1 3 2 8 9 5 y 7 18 5 13 15 9
(Multiple Choice)
4.7/5 (38)
The following table presents the number of police officers (per 100,000 citizens) and the annual murder rate (per 100,000 citizens) for a sample of cities. Police Officers (per 100,000) Murders (per 100,000 per yr) 1109 46 1238 44 1235 38 1298 40 1077 49 1076 42 Compute the correlation coefficient between the per capita number of police officers and the per capita
Murder rate.
(Multiple Choice)
4.8/5 (45)
Filters
- Essay(0)
- Multiple Choice(0)
- Short Answer(0)
- True False(0)
- Matching(0)