Exam 13: Linear Regression and Correlation
Exam 1: What Is Statistics79 Questions
Exam 2: Describing Data: Frequencydistributions and Graphic Presentation100 Questions
Exam 3: Describing Data: Numerical Measures214 Questions
Exam 4: Describing Data: Displaying and Exploring Pata138 Questions
Exam 5: A Sulvey of Probability Concepts121 Questions
Exam 6: Discrete Probability Distributions145 Questions
Exam 7: Continuous Probabilitydistributions79 Questions
Exam 8: Sampling Methods and the Central Umit Theorem134 Questions
Exam 9: Estimation and Confidence Intervals140 Questions
Exam 10: One-Sample Tests of Hypothesis111 Questions
Exam 11: Two Sample Tests of Hypothesis103 Questions
Exam 12: Analysis of Variance173 Questions
Exam 13: Linear Regression and Correlation132 Questions
Exam 14: Multiple Regression and Correlation Analysis126 Questions
Exam 15: Chi-Square Applications94 Questions
Exam 16: Decision Making and Payoff Tables in Investment Scenarios151 Questions
Select questions type
The best example of a null hypothesis for testing an individual regression coefficient is:
(Multiple Choice)
4.7/5  (23)
(23)
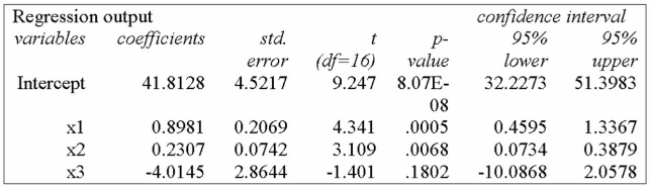
It is thought that there are a variety of factors that affect a teacher's salary. Using the following
Printout and sample data, determine whether the holding of a PhD degree is a significant variable
When tested at the 5% level of significance. 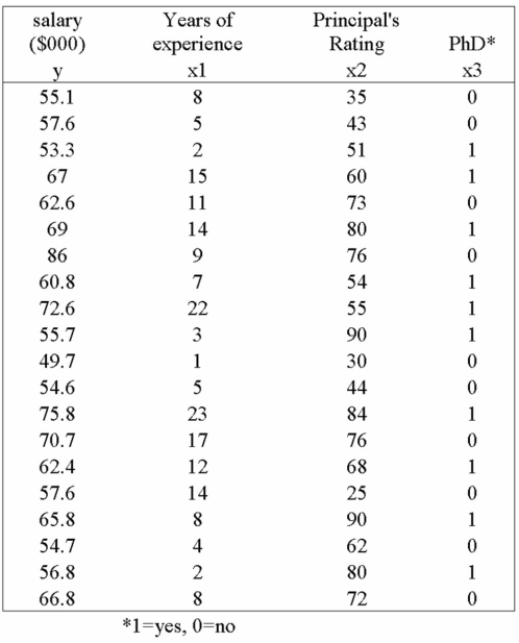
(Multiple Choice)
4.9/5 (43)
Multiple regression analysis is applied when analyzing the relationship between
(Multiple Choice)
4.9/5 (29)
It has been hypothesized that overall academic success for freshmen at college as measured by
Grade point average (GPA) is a function of IQ scores (X1), hours spent studying each week (X2), and
One's high school average (X3). Suppose the regression equation is:
Y' = -6.9 + 0.055X1 + 0.107X2 + 0.0083X3.
The multiple standard error is 6.313 and R2 = 0.826.For which independent variable does a unit
Change have the greatest effect on the GPA?
(Multiple Choice)
5.0/5 (28)
A sample of General Mills employees was studied to determine their degree of satisfaction with
Their present life. A special index, called the index of satisfaction, was used to measure satisfaction.
Six factors were studied: age at the time of first marriage (X1), annual income (X2), number of
Children living (X3), value of all assets (X4), status of health in the form of an index (X5), and the
Average number of social activities per week (X6). Suppose the multiple regression equation is:
Y' = 16.24 + 0.017X1 + 0.00028X2 + 42X3 + 0.0012X4 + 0.19X5 + 26.8X6.
What is the estimated index of satisfaction for a person who first married at 25, has an annual
Income of $26,500, has two children, has assets of $156,000, has in index of health status of 141,
And has 2.5 social activities per week?
(Multiple Choice)
4.8/5 (26)
If the correlation between the two independent variables of a regression analysis is 0.11 and each
Independent variable is highly correlated to the dependent variable, what does this indicate?
(Multiple Choice)
4.7/5 (34)
How much does tire production change for every thousand cars produced three years ago?
(Multiple Choice)
4.8/5 (38)
A manager at a local bank analyzed the relationship between monthly salary and three independent
Variables: length of service (measured in months), gender (0 = female, 1 = male) and job type (0 =
Clerical, 1 = technical). The following ANOVA summarizes the regression results: 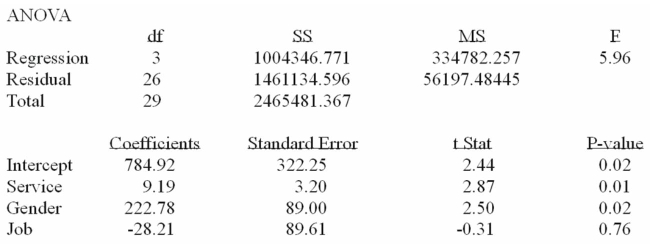 Based on the ANOVA, the multiple coefficient of determination is
(Multiple Choice)
4.9/5 (33)
How much does tire production increase for every thousand cars produced two years ago?
(Multiple Choice)
4.8/5 (37)
A multiple regression analysis showed the following results of the individual independent variables. 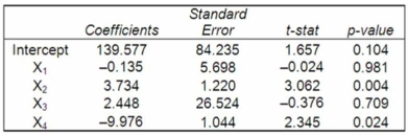 In stepwise regression, which independent variable would most likely be added first?
(Multiple Choice)
4.9/5 (32)
Determine the multiple regression equation. _______________________
(Multiple Choice)
4.9/5 (38)
Angela Chou has been asked to investigate the determinants of poverty in Ontario communities.
She collected data on 60 communities from Statistics Canada. She selected the percentage of poor
Persons living under the poverty line [Poor (%)], measured by Low Income Cut-Off, designed by
Statistics Canada as a measure of poverty for a community, as the dependent variable. The
Independent variables selected are percent of single families in each community, the
Unemployment rate in each community, percent of population in the community holding a bachelor's
Degree as their highest level of education attained, and percent of population holding a High
School Diploma as their highest level of education attained. Using the outputs below for this data
Set, determine whether Angela should use the model with the high school data included, or the
Data without the high school data, and why. ![Angela Chou has been asked to investigate the determinants of poverty in Ontario communities. She collected data on 60 communities from Statistics Canada. She selected the percentage of poor Persons living under the poverty line [Poor (%)], measured by Low Income Cut-Off, designed by Statistics Canada as a measure of poverty for a community, as the dependent variable. The Independent variables selected are percent of single families in each community, the Unemployment rate in each community, percent of population in the community holding a bachelor's Degree as their highest level of education attained, and percent of population holding a High School Diploma as their highest level of education attained. Using the outputs below for this data Set, determine whether Angela should use the model with the high school data included, or the Data without the high school data, and why.](https://storage.examlex.com/TB1024/11eb5577_4302_8582_a086_addcc63871d2_TB1024_00.jpg)
![Angela Chou has been asked to investigate the determinants of poverty in Ontario communities. She collected data on 60 communities from Statistics Canada. She selected the percentage of poor Persons living under the poverty line [Poor (%)], measured by Low Income Cut-Off, designed by Statistics Canada as a measure of poverty for a community, as the dependent variable. The Independent variables selected are percent of single families in each community, the Unemployment rate in each community, percent of population in the community holding a bachelor's Degree as their highest level of education attained, and percent of population holding a High School Diploma as their highest level of education attained. Using the outputs below for this data Set, determine whether Angela should use the model with the high school data included, or the Data without the high school data, and why.](https://storage.examlex.com/TB1024/11eb5577_4302_8583_a086_7707ac22cb11_TB1024_00.jpg)
(Multiple Choice)
4.9/5 (38)
i. A variable whose possible outcomes are coded as a "1" or a "0" is called a dummy variable.
ii. A dummy variable is added to the regression equation to control for error.
iii. If the null hypothesis β4 = 0 is not rejected, then the independent variable X4 has no effect in
Predicting the dependent variable.
(Multiple Choice)
4.8/5 (37)
For a unit change in the first independent variable with other things being held constant, what
Change can be expected in the dependent variable in the multiple regression equation Y' = 5.2 +
6)3X1 - 7.1X2?
(Multiple Choice)
4.9/5 (34)
i. Violating the need for successive observations of the dependent variable to be uncorrelated is
Called autocorrelation.
ii. If an inverse relationship exists between the dependent variable and independent variables, the
Regression coefficients for the independent variables are negative.
iii. Given a multiple linear equation Y' = 5.1 + 2.2X1 - 3.5X2, assuming other things are held constant,
An increase in one unit of the second independent variable will cause a -3.5 unit change in Y.
(Multiple Choice)
4.7/5 (35)
i. The values of b1, b2 and b3 in a multiple regression equation are called the net regression
Coefficients. They indicate the change in the predicted value for a unit change in one X when the
Other X variables are held constant.
ii. A multiple regression equation defines the relationship between the dependent variable and the
Independent variables in the form of an equation.
iii. If an inverse relationship exists between the dependent variable and independent variables, the
Regression coefficients for the independent variables are positive.
(Multiple Choice)
4.9/5 (37)
Which of the following has the most influence on salary--20 years of seniority, 5 years of college or
Attaining 55 years of age?
(Multiple Choice)
4.9/5 (43)
The information below is from the multiple regression analysis computer output for 28 teams in
Major League Baseball. The model is designed to predict wins using attendance, payroll, batting
Average, home runs, stolen bases, errors, and team ERA. 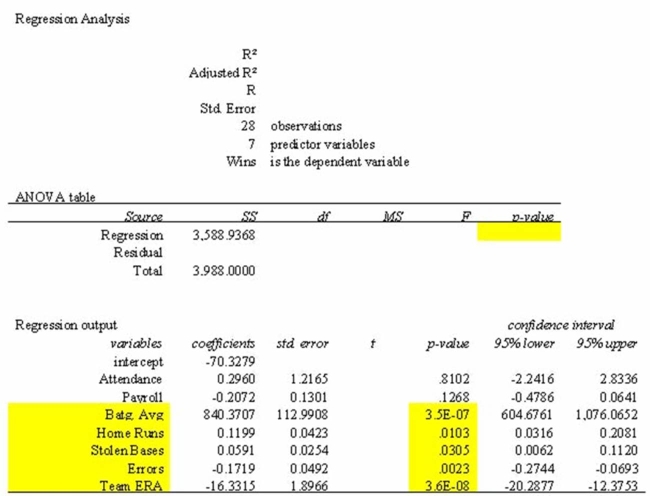 Predict the number of wins for a team with:
BATAVG = 0.260 HOMERUNS = 150 ERA = 3
STOLENBASE = 100 ERROR = 100
PAYROLL = 25(million)
ATTENDANCE = 3(million)
Predict the number of wins for a team with:
BATAVG = 0.260 HOMERUNS = 150 ERA = 3
STOLENBASE = 100 ERROR = 100
PAYROLL = 25(million)
ATTENDANCE = 3(million)
(Multiple Choice)
4.9/5 (41)
The following graph is used to evaluate an assumption of a multiple regression analysis. What is the
Assumption? 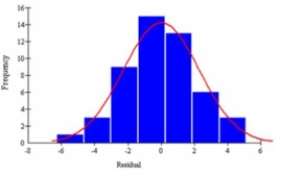
(Multiple Choice)
4.9/5 (45)
Filters
- Essay(0)
- Multiple Choice(0)
- Short Answer(0)
- True False(0)
- Matching(0)