Exam 4: Basic Probability
Exam 1: Introduction145 Questions
Exam 2: Organizing and Visualizing Data210 Questions
Exam 3: Numerical Descriptive Measures153 Questions
Exam 4: Basic Probability171 Questions
Exam 5: Discrete Probability Distributions218 Questions
Exam 6: The Normal Distribution and Other Continuous Distributions191 Questions
Exam 7: Sampling and Sampling Distributions197 Questions
Exam 8: Confidence Interval Estimation196 Questions
Exam 9: Fundamentals of Hypothesis Testing: One-Sample Tests165 Questions
Exam 10: Two-Sample Tests210 Questions
Exam 11: Analysis of Variance213 Questions
Exam 12: Chi-Square Tests and Nonparametric Tests201 Questions
Exam 13: Simple Linear Regression213 Questions
Exam 14: Introduction to Multiple Regression355 Questions
Exam 15: Multiple Regression Model Building96 Questions
Exam 16: Time-Series Forecasting168 Questions
Exam 17: Statistical Applications in Quality Management133 Questions
Exam 18: A Roadmap for Analyzing Data54 Questions
Exam 19: Questions that Involve Online Topics321 Questions
Select questions type
According to a survey of American households, the probability that the residents own 2 cars if annual household income is over $50,000 is 80%. Of the households surveyed, 60% had incomes over $50,000 and 70% had 2 cars. The probability that the residents of a household own 2 cars and have an income less than or equal to $50,000 a year is
(Multiple Choice)
4.9/5  (33)
(33)
TABLE 4-2
An alcohol awareness task force at a Big-Ten university sampled 200 students after the midterm to ask them whether they went bar hopping the weekend before the midterm or spent the weekend studying, and whether they did well or poorly on the midterm. The following result was obtained.
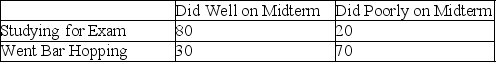 -Referring to Table 4-2, the events "Did Well on Midterm" and "Studying for Exam" are
(Multiple Choice)
4.8/5 (37)
TABLE 4-2
An alcohol awareness task force at a Big-Ten university sampled 200 students after the midterm to ask them whether they went bar hopping the weekend before the midterm or spent the weekend studying, and whether they did well or poorly on the midterm. The following result was obtained.
-Referring to Table 4-2, the events "Did Well on Midterm" and "Did Poorly on Midterm" are
(Multiple Choice)
4.8/5 (38)
TABLE 4-6
At a Texas college, 60% of the students are from the southern part of the state, 30% are from the northern part of the state, and the remaining 10% are from out-of-state. All students must take and pass an Entry Level Math (ELM) test. 60% of the southerners have passed the ELM, 70% of the northerners have passed the ELM, and 90% of the out-of-staters have passed the ELM.
-Referring to Table 4-6, if a randomly selected student is not from out-of-state, the probability the student has passed the ELM is ________.
(Short Answer)
4.7/5 (28)
TABLE 4-8
According to the record of the registrar's office at a state university, 35% of the students are freshman, 25% are sophomore, 16% are junior and the rest are senior. Among the freshmen, sophomores, juniors and seniors, the portion of students who live in the dormitory are, respectively, 80%, 60%, 30% and 20%.
-Referring to Table 4-8, what is the probability that a randomly selected student is a junior who does not live in a dormitory?
(Short Answer)
4.8/5 (38)
According to a survey of American households, the probability that the residents own 2 cars if annual household income is over $50,000 is 80%. Of the households surveyed, 60% had incomes over $50,000 and 70% had 2 cars. The probability that annual household income is over $50,000 if the residents of a household do not own 2 cars is
(Multiple Choice)
4.9/5 (31)
According to a survey of American households, the probability that the residents own 2 cars if annual household income is over $50,000 is 80%. Of the households surveyed, 60% had incomes over $50,000 and 70% had 2 cars. The probability that the residents of a household do not own 2 cars and have an income over $50,000 a year is
(Multiple Choice)
4.7/5 (38)
According to a survey of American households, the probability that the residents own 2 cars if annual household income is over $50,000 is 80%. Of the households surveyed, 60% had incomes over $50,000 and 70% had 2 cars. The probability that annual household income is over $50,000 if the residents of a household own 2 cars is
(Multiple Choice)
4.8/5 (39)
The probability that house sales will increase in the next 6 months is estimated to be 0.25. The probability that the interest rates on housing loans will go up in the same period is estimated to be 0.74. The probability that house sales or interest rates will go up during the next 6 months is estimated to be 0.89. The probability that neither house sales nor interest rates will increase during the next 6 months is
(Multiple Choice)
4.8/5 (36)
TABLE 4-11
A sample of 300 adults is selected. The contingency table below shows their registration status and their preferred source of information on current events.
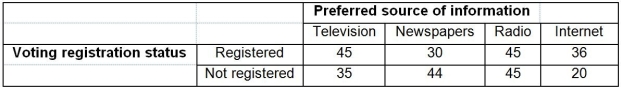 -Referring to Table 4-11, if an adult is selected at random, what is the probability that he/she is a registered voter who does not prefer to get his/her current information from the Internet?
(Short Answer)
4.7/5 (32)
If two events are mutually exclusive, what is the probability that both occur at the same time?
(Multiple Choice)
4.8/5 (29)
TABLE 4-1
Mothers Against Drunk Driving is a very visible group whose main focus is to educate the public about the harm caused by drunk drivers. A study was recently done that emphasized the problem we all face with drinking and driving. Four hundred accidents that occurred on a Saturday night were analyzed. Two items noted were the number of vehicles involved and whether alcohol played a role in the accident. The numbers are shown below:
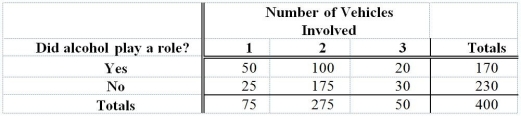 -Referring to Table 4-1, given alcohol was involved, what proportion of accidents involved a single vehicle?
(Multiple Choice)
4.9/5 (31)
When using the general multiplication rule, P(A and B) is equal to
(Multiple Choice)
4.9/5 (36)
According to a survey of American households, the probability that the residents own 2 cars if annual household income is over $50,000 is 80%. Of the households surveyed, 60% had incomes over $50,000 and 70% had 2 cars. The probability that the residents do not own 2 cars if annual household income is not over $50,000 is
(Multiple Choice)
4.9/5 (27)
TABLE 4-5
In a meat packaging plant, Machine A accounts for 60% of the plant's output, while Machine B accounts for 40% of the plant's output. In total, 4% of the packages are improperly sealed. Also, 3% of the packages are from Machine A and are improperly sealed.
-Referring to Table 4-5, if a package selected at random came from Machine B, the probability that it is improperly sealed is ________.
(Short Answer)
4.8/5 (30)
TABLE 4-6
At a Texas college, 60% of the students are from the southern part of the state, 30% are from the northern part of the state, and the remaining 10% are from out-of-state. All students must take and pass an Entry Level Math (ELM) test. 60% of the southerners have passed the ELM, 70% of the northerners have passed the ELM, and 90% of the out-of-staters have passed the ELM.
-Referring to Table 4-6, if a randomly selected student has not passed the ELM, the probability the student is not from northern Texas is ________.
(Short Answer)
4.9/5 (29)
TABLE 4-10
Are whites more likely to claim bias? It was found that 60% of the workers were white, 30% were black and 10% are other races. Given that a worker was white, the probability that the worker had claimed bias was 30%. Given that a worker was black, the probability that the worker had claimed bias was 40%. Given that a worker was other race, the probability that the worker had claimed bias was 0%.
-Referring to Table 4-10, if a randomly selected worker had claimed bias, what is the probability that the worker is white?
(Short Answer)
4.8/5 (38)
TABLE 4-4
Suppose that patrons of a restaurant were asked whether they preferred water or whether they preferred soda. 70% said that they preferred water. 60% of the patrons were male. 80% of the males preferred water.
-Referring to Table 4-4, the two events "preferring water" and "being a male" are independent.
(True/False)
4.8/5 (43)
TABLE 4-11
A sample of 300 adults is selected. The contingency table below shows their registration status and their preferred source of information on current events.
-Referring to Table 4-11, if a randomly selected adult is a registered voter, what is the probability that he/she prefers to get his/her current information from the newspapers?
(Short Answer)
4.7/5 (27)
Filters
- Essay(0)
- Multiple Choice(0)
- Short Answer(0)
- True False(0)
- Matching(0)