Exam 10: Two-Sample Tests
Exam 1: Introduction145 Questions
Exam 2: Organizing and Visualizing Data210 Questions
Exam 3: Numerical Descriptive Measures153 Questions
Exam 4: Basic Probability171 Questions
Exam 5: Discrete Probability Distributions218 Questions
Exam 6: The Normal Distribution and Other Continuous Distributions191 Questions
Exam 7: Sampling and Sampling Distributions197 Questions
Exam 8: Confidence Interval Estimation196 Questions
Exam 9: Fundamentals of Hypothesis Testing: One-Sample Tests165 Questions
Exam 10: Two-Sample Tests210 Questions
Exam 11: Analysis of Variance213 Questions
Exam 12: Chi-Square Tests and Nonparametric Tests201 Questions
Exam 13: Simple Linear Regression213 Questions
Exam 14: Introduction to Multiple Regression355 Questions
Exam 15: Multiple Regression Model Building96 Questions
Exam 16: Time-Series Forecasting168 Questions
Exam 17: Statistical Applications in Quality Management133 Questions
Exam 18: A Roadmap for Analyzing Data54 Questions
Exam 19: Questions that Involve Online Topics321 Questions
Select questions type
In testing for differences between the means of two independent populations, the null hypothesis is
(Multiple Choice)
4.9/5  (32)
(32)
The Wall Street Journal recently published an article indicating differences in perception of sexual harassment on the job between men and women. The article claimed that women perceived the problem to be much more prevalent than did men. One question asked of both men and women was: "Do you think sexual harassment is a major problem in the American workplace?" 24% of the men compared to 62% of the women responded "Yes." Assuming W designates women's responses and M designates men's, what hypothesis should The Wall Street Journal test in order to show that its claim is true?
(Multiple Choice)
5.0/5 (43)
The sample size in each independent sample must be the same if we are to test for differences between the means of two independent populations.
(True/False)
4.8/5 (30)
TABLE 10-15
The table below presents the summary statistics for the starting annual salaries (in thousands of dollars) for individuals entering the public accounting and financial planning professions.
Sample I (public accounting):  ₁ = 60.35, S₁ = 3.25, n₁ = 12
Sample II (financial planning):
₁ = 60.35, S₁ = 3.25, n₁ = 12
Sample II (financial planning):  ₂ = 58.20, S₂ = 2.48, n₂ = 14
Test whether the mean starting annual salaries for individuals entering the public accounting professions is higher than that of financial planning assuming that the two population variances are the same.
-Referring to Table 10-15, suppose α = 0.10. Which of the following represents the correct conclusion?
₂ = 58.20, S₂ = 2.48, n₂ = 14
Test whether the mean starting annual salaries for individuals entering the public accounting professions is higher than that of financial planning assuming that the two population variances are the same.
-Referring to Table 10-15, suppose α = 0.10. Which of the following represents the correct conclusion?
(Multiple Choice)
4.9/5 (37)
TABLE 10-10
A corporation randomly selects 150 salespeople and finds that 66% who have never taken a self-improvement course would like such a course. The firm did a similar study 10 years ago in which 60% of a random sample of 160 salespeople wanted a self-improvement course. The groups are assumed to be independent random samples. Let π₁ and π₂ represent the true proportion of workers who would like to attend a self-improvement course in the recent study and the past study, respectively.
-Referring to Table 10-11, if the firm wanted to test whether this proportion has changed from the previous study, which represents the relevant hypotheses?
(Multiple Choice)
4.9/5 (39)
TABLE 10-5
To test the effectiveness of a business school preparation course, 8 students took a general business test before and after the course. The results are given below.
Exam Score Exam Score
Student Before Course (1) After Course (2)
1 530 670
2 690 770
3 910 1,000
4 700 710
5 450 550
6 820 870
7 820 770
8 630 610
-Referring to Table 10-5, what is the critical value for testing at the 5% level of significance whether the business school preparation course is effective in improving exam scores?
(Multiple Choice)
4.8/5 (30)
TABLE 10-9
The following Excel output contains the results of a test to determine whether the proportions of satisfied customers at two resorts are the same or different.
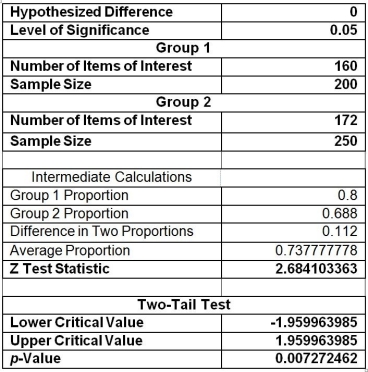 -Referring to Table 10-9, allowing for 1% probability of committing a Type I error, what are the decision and conclusion on testing whether there is any difference in the proportions of satisfied customers in the two resorts?
(Multiple Choice)
4.9/5 (40)
TABLE 10-6
To investigate the efficacy of a diet, a random sample of 16 male patients is selected from a population of adult males using the diet. The weight of each individual in the sample is taken at the start of the diet and at a medical follow-up 4 weeks later. Assuming that the population of differences in weight before versus after the diet follow a normal distribution, the t test for related samples can be used to determine if there was a significant decrease in the mean weight during this period. Suppose the mean decrease in weights over all 16 subjects in the study is 3.0 pounds with the standard deviation of differences computed as 6.0 pounds.
-Referring to Table 10-6, the t test should be ________ -tail.
(Short Answer)
4.9/5 (46)
TABLE 10-6
To investigate the efficacy of a diet, a random sample of 16 male patients is selected from a population of adult males using the diet. The weight of each individual in the sample is taken at the start of the diet and at a medical follow-up 4 weeks later. Assuming that the population of differences in weight before versus after the diet follow a normal distribution, the t test for related samples can be used to determine if there was a significant decrease in the mean weight during this period. Suppose the mean decrease in weights over all 16 subjects in the study is 3.0 pounds with the standard deviation of differences computed as 6.0 pounds.
-Referring to Table 10-6, the critical value for a one-tail test of the null hypothesis of no difference at the α = 0.05 level of significance is ________.
(Short Answer)
4.9/5 (34)
The Wall Street Journal recently ran an article indicating differences in perception of sexual harassment on the job between men and women. The article claimed that women perceived the problem to be much more prevalent than did men. One question asked to both men and women was: "Do you think sexual harassment is a major problem in the American workplace?" Some 24% of the men compared to 62% of the women responded "Yes." Suppose that 150 women and 200 men were interviewed. For a 0.01 level of significance, what is the critical value for the rejection region?
(Multiple Choice)
5.0/5 (33)
TABLE 10-12
A quality control engineer is in charge of the manufacture of computer disks. Two different processes can be used to manufacture the disks. He suspects that the Kohler method produces a greater proportion of defects than the Russell method. He samples 150 of the Kohler and 200 of the Russell disks and finds that 27 and 18 of them, respectively, are defective. If Kohler is designated as "Group 1" and Russell is designated as "Group 2," perform the appropriate test at a level of significance of 0.01.
-Referring to Table 10-12, the null hypothesis should be rejected.
(True/False)
4.9/5 (38)
TABLE 10-4
Two samples each of size 25 are taken from independent populations assumed to be normally distributed with equal variances. The first sample has a mean of 35.5 and standard deviation of 3.0 while the second sample has a mean of 33.0 and standard deviation of 4.0.
-Referring to Table 10-4, what is the 99% confidence interval estimate for the difference in the two means?
(Short Answer)
4.9/5 (44)
TABLE 10-5
To test the effectiveness of a business school preparation course, 8 students took a general business test before and after the course. The results are given below.
Exam Score Exam Score
Student Before Course (1) After Course (2)
1 530 670
2 690 770
3 910 1,000
4 700 710
5 450 550
6 820 870
7 820 770
8 630 610
-Referring to Table 10-5, at the 0.05 level of significance, the conclusion for this hypothesis test is that there is sufficient evidence that
(Multiple Choice)
4.8/5 (46)
Moving companies are required by the government to publish a Carrier Performance Report each year. One of the descriptive statistics they must include is the annual percentage of shipments on which a $50 or greater claim for loss or damage was filed. Suppose two companies, Econo-Move and On-the-Move, each decide to estimate this figure by sampling their records, and they report the data shown in the following table. 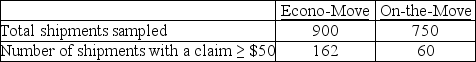 The owner of On-the-Move is hoping to use these data to show that the company is superior to Econo-Move with regard to the percentage of claims filed. Which test would be used to properly analyze the data in this experiment?
(Multiple Choice)
4.9/5 (29)
TABLE 10-15
The table below presents the summary statistics for the starting annual salaries (in thousands of dollars) for individuals entering the public accounting and financial planning professions.
Sample I (public accounting): ₁ = 60.35, S₁ = 3.25, n₁ = 12
Sample II (financial planning): ₂ = 58.20, S₂ = 2.48, n₂ = 14
Test whether the mean starting annual salaries for individuals entering the public accounting professions is higher than that of financial planning assuming that the two population variances are the same.
-Referring to Table 10-15, what assumptions are necessary for testing whether there is evidence of a difference in the variances to be valid?
(Multiple Choice)
4.9/5 (36)
TABLE 10-7
A buyer for a manufacturing plant suspects that his primary supplier of raw materials is overcharging. In order to determine if his suspicion is correct, he contacts a second supplier and asks for the prices on various identical materials. He wants to compare these prices with those of his primary supplier. The data collected is presented in the table below, with some summary statistics presented (all of these might not be necessary to answer the questions which follow). The buyer believes that the differences are normally distributed and will use this sample to perform an appropriate test at a level of significance of 0.01.
Primary Secondary
Material Supplier Supplier Difference
1 $55 $45 $10
2 $48 $47 $1
3 $31 $32 -$1
4 $83 $77 $6
5 $37 $37 $0
6 $55 $54 $1
Sum: $309 $292 $17
Sum of Squares: $17,573 $15,472 $139
-Referring to Table 10-7, the p-value of the test statistic is ________.
(Essay)
4.9/5 (33)
TABLE 10-7
A buyer for a manufacturing plant suspects that his primary supplier of raw materials is overcharging. In order to determine if his suspicion is correct, he contacts a second supplier and asks for the prices on various identical materials. He wants to compare these prices with those of his primary supplier. The data collected is presented in the table below, with some summary statistics presented (all of these might not be necessary to answer the questions which follow). The buyer believes that the differences are normally distributed and will use this sample to perform an appropriate test at a level of significance of 0.01.
Primary Secondary
Material Supplier Supplier Difference
1 $55 $45 $10
2 $48 $47 $1
3 $31 $32 -$1
4 $83 $77 $6
5 $37 $37 $0
6 $55 $54 $1
Sum: $309 $292 $17
Sum of Squares: $17,573 $15,472 $139
-Referring to Table 10-7, what is the 95% confidence interval estimate for the mean difference in prices?
(Short Answer)
4.8/5 (33)
TABLE 10-13
The amount of time required to reach a customer service representative has a huge impact on customer satisfaction. Below is the Excel output from a study to see whether there is evidence of a difference in the mean amounts of time required to reach a customer service representative between two hotels. Assume that the population variances in the amount of time for the two hotels are not equal.
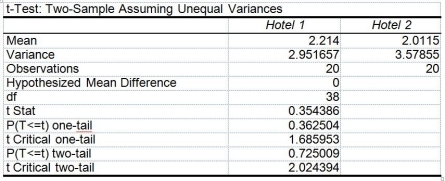 -Referring to Table 10-13, what is the largest level of significance at which a test on a difference in the variabilities of the amount of time required to reach a customer service representative between the two hotels will not be rejected?
(Essay)
4.8/5 (38)
TABLE 10-1
Are Japanese managers more motivated than American managers? A randomly selected group of each were administered the Sarnoff Survey of Attitudes Toward Life (SSATL), which measures motivation for upward mobility. The SSATL scores are summarized below.
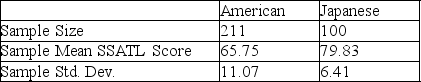 -Referring to Table 10-1, judging from the way the data were collected, which test would likely be most appropriate to employ?
(Multiple Choice)
4.9/5 (32)
TABLE 10-11
The dean of a college is interested in the proportion of graduates from his college who have a job offer on graduation day. He is particularly interested in seeing if there is a difference in this proportion for accounting and economics majors. In a random sample of 100 of each type of major at graduation, he found that 65 accounting majors and 52 economics majors had job offers. If the accounting majors are designated as "Group 1" and the economics majors are designated as "Group 2," perform the appropriate hypothesis test using a level of significance of 0.05.
-Referring to Table 10-11, the same decision would be made with this test if the level of significance had been 0.01 rather than 0.05.
(True/False)
4.9/5 (34)
Filters
- Essay(0)
- Multiple Choice(0)
- Short Answer(0)
- True False(0)
- Matching(0)