Exam 16: Time-Series Forecasting
Exam 1: Introduction145 Questions
Exam 2: Organizing and Visualizing Data210 Questions
Exam 3: Numerical Descriptive Measures153 Questions
Exam 4: Basic Probability171 Questions
Exam 5: Discrete Probability Distributions218 Questions
Exam 6: The Normal Distribution and Other Continuous Distributions191 Questions
Exam 7: Sampling and Sampling Distributions197 Questions
Exam 8: Confidence Interval Estimation196 Questions
Exam 9: Fundamentals of Hypothesis Testing: One-Sample Tests165 Questions
Exam 10: Two-Sample Tests210 Questions
Exam 11: Analysis of Variance213 Questions
Exam 12: Chi-Square Tests and Nonparametric Tests201 Questions
Exam 13: Simple Linear Regression213 Questions
Exam 14: Introduction to Multiple Regression355 Questions
Exam 15: Multiple Regression Model Building96 Questions
Exam 16: Time-Series Forecasting168 Questions
Exam 17: Statistical Applications in Quality Management133 Questions
Exam 18: A Roadmap for Analyzing Data54 Questions
Exam 19: Questions that Involve Online Topics321 Questions
Select questions type
TABLE 16-14
A contractor developed a multiplicative time-series model to forecast the number of contracts in future quarters, using quarterly data on number of contracts during the 3-year period from 2008 to 2010. The following is the resulting regression equation:
ln Ŷ = 3.37 + 0.117 X - 0.083 Q₁ + 1.28 Q₂ + 0.617 Q₃
where Ŷ is the estimated number of contracts in a quarter
X is the coded quarterly value with X = 0 in the first quarter of 2008.
Q₁ is a dummy variable equal to 1 in the first quarter of a year and 0 otherwise.
Q₂ is a dummy variable equal to 1 in the second quarter of a year and 0 otherwise.
Q₃ is a dummy variable equal to 1 in the third quarter of a year and 0 otherwise.
-Referring to Table 16-14, the best interpretation of the coefficient of X (0.117) in the regression equation is
(Multiple Choice)
4.9/5  (42)
(42)
TABLE 16-10
Business closures in Laramie, Wyoming from 2005 to 2010 were: 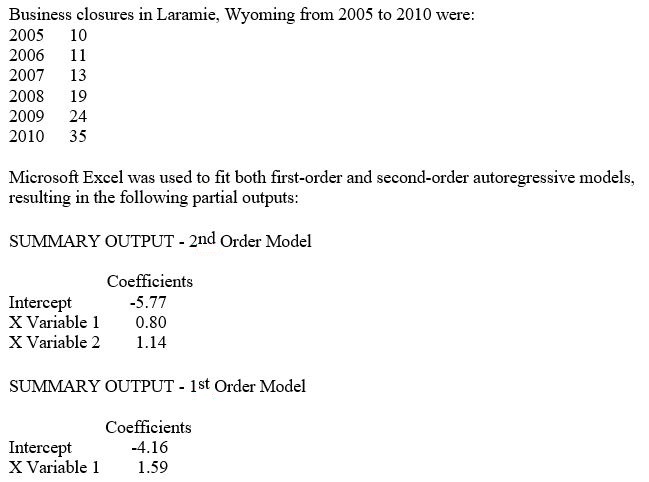 -Referring to Table 16-10, the values of the MAD for the two models indicate that the first-order model should be used for forecasting.
(True/False)
4.9/5 (34)
TABLE 16-1
The number of cases of chardonnay wine sold by a Paso Robles winery in an 8-year period follows. 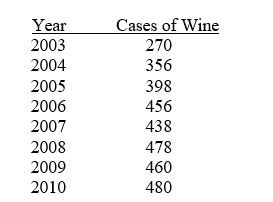 -Referring to Table 16-1, does there appear to be a relationship between year and the number of cases of wine sold?
(Multiple Choice)
4.9/5 (30)
TABLE 16-13
Given below is the monthly time-series data for U.S. retail sales of building materials over a specific year.
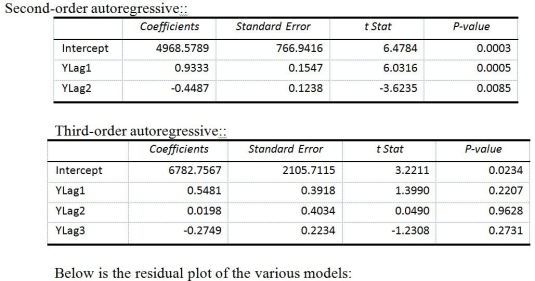
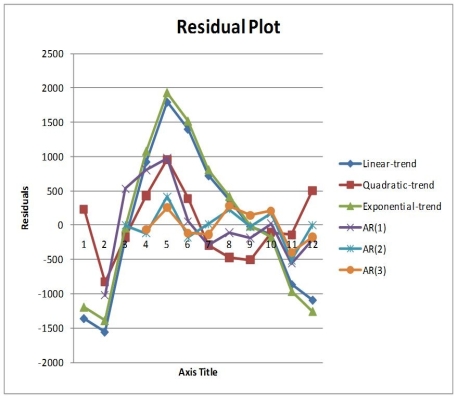
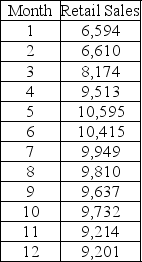 The results of the linear trend, quadratic trend, exponential trend, first-order autoregressive, second-order autoregressive and third-order autoregressive model are presented below in which the coded month for the first month is 0:
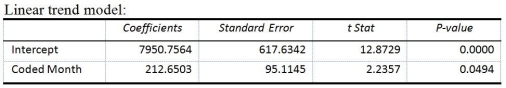
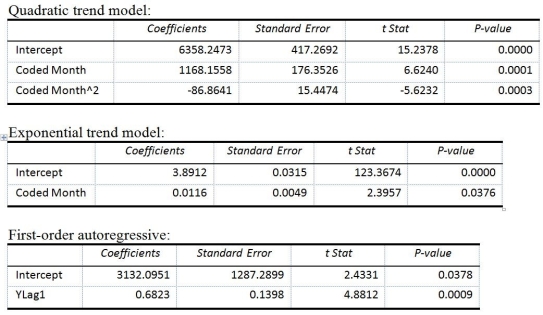
 -Referring to Table 16-13, what is the p-value for the t test statistic for testing the significance of the quadratic term in the quadratic-trend model?
(Short Answer)
4.9/5 (36)
TABLE 16-13
Given below is the monthly time-series data for U.S. retail sales of building materials over a specific year.
The results of the linear trend, quadratic trend, exponential trend, first-order autoregressive, second-order autoregressive and third-order autoregressive model are presented below in which the coded month for the first month is 0:
-Referring to Table 16-13, what is your estimated annual compound growth rate using the exponential-trend model?
(Short Answer)
4.8/5 (40)
TABLE 16-12
A local store developed a multiplicative time-series model to forecast its revenues in future quarters, using quarterly data on its revenues during the 4-year period from 2005 to 2009. The following is the resulting regression equation:
log₁₀  = 6.102 + 0.012 X - 0.129 Q₁ - 0.054 Q₂ + 0.098 Q₃
where
= 6.102 + 0.012 X - 0.129 Q₁ - 0.054 Q₂ + 0.098 Q₃
where  is the estimated number of contracts in a quarter.
X is the coded quarterly value with X = 0 in the first quarter of 2005.
Q₁ is a dummy variable equal to 1 in the first quarter of a year and 0 otherwise.
Q₂ is a dummy variable equal to 1 in the second quarter of a year and 0 otherwise.
Q₃ is a dummy variable equal to 1 in the third quarter of a year and 0 otherwise.
-Referring to Table 16-12, using the regression equation, what is the forecast for the revenues in the third quarter of 2010?
is the estimated number of contracts in a quarter.
X is the coded quarterly value with X = 0 in the first quarter of 2005.
Q₁ is a dummy variable equal to 1 in the first quarter of a year and 0 otherwise.
Q₂ is a dummy variable equal to 1 in the second quarter of a year and 0 otherwise.
Q₃ is a dummy variable equal to 1 in the third quarter of a year and 0 otherwise.
-Referring to Table 16-12, using the regression equation, what is the forecast for the revenues in the third quarter of 2010?
(Short Answer)
4.9/5 (27)
TABLE 16-10
Business closures in Laramie, Wyoming from 2005 to 2010 were:
-Referring to Table 16-10, the fitted values for the second-order autoregressive model are ________, ________, ________, and ________.
(Short Answer)
4.8/5 (44)
TABLE 16-14
A contractor developed a multiplicative time-series model to forecast the number of contracts in future quarters, using quarterly data on number of contracts during the 3-year period from 2008 to 2010. The following is the resulting regression equation:
ln Ŷ = 3.37 + 0.117 X - 0.083 Q₁ + 1.28 Q₂ + 0.617 Q₃
where Ŷ is the estimated number of contracts in a quarter
X is the coded quarterly value with X = 0 in the first quarter of 2008.
Q₁ is a dummy variable equal to 1 in the first quarter of a year and 0 otherwise.
Q₂ is a dummy variable equal to 1 in the second quarter of a year and 0 otherwise.
Q₃ is a dummy variable equal to 1 in the third quarter of a year and 0 otherwise.
-Referring to Table 16-14, to obtain a forecast for the fourth quarter of 2011 using the model, which of the following sets of values should be used in the regression equation?
(Multiple Choice)
4.8/5 (36)
TABLE 16-11
The manager of a health club has recorded mean attendance in newly introduced step classes over the last 15 months: 32.1, 39.5, 40.3, 46.0, 65.2, 73.1, 83.7, 106.8, 118.0, 133.1, 163.3, 182.8, 205.6, 249.1, and 263.5. She then used Microsoft Excel to obtain the following partial output for both a first- and second-order autoregressive model. 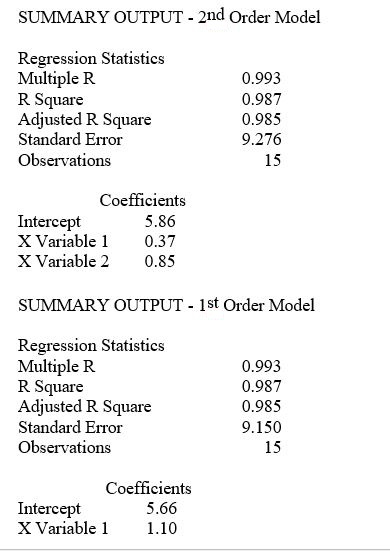 -Referring to Table 16-11, using the first-order model, the forecast of mean attendance for month 16 is ________.
(Short Answer)
4.9/5 (31)
The principle of parsimony indicates that the simplest model that gets the job done adequately should be used.
(True/False)
4.7/5 (37)
The overall upward or downward pattern of the data in an annual time series will be contained in the ________ component.
(Multiple Choice)
4.8/5 (38)
Each forecast using the method of exponential smoothing depends on all the previous observations in the time series.
(True/False)
4.8/5 (30)
TABLE 16-13
Given below is the monthly time-series data for U.S. retail sales of building materials over a specific year.
The results of the linear trend, quadratic trend, exponential trend, first-order autoregressive, second-order autoregressive and third-order autoregressive model are presented below in which the coded month for the first month is 0:
-Referring to Table 16-13, what is your forecast for the 13ᵗʰ month using the linear-trend model?
(Short Answer)
4.8/5 (31)
TABLE 16-11
The manager of a health club has recorded mean attendance in newly introduced step classes over the last 15 months: 32.1, 39.5, 40.3, 46.0, 65.2, 73.1, 83.7, 106.8, 118.0, 133.1, 163.3, 182.8, 205.6, 249.1, and 263.5. She then used Microsoft Excel to obtain the following partial output for both a first- and second-order autoregressive model.
-Referring to Table 16-11, using the second-order model, the forecast of mean attendance for month 16 is ________.
(Short Answer)
4.8/5 (35)
TABLE 16-12
A local store developed a multiplicative time-series model to forecast its revenues in future quarters, using quarterly data on its revenues during the 4-year period from 2005 to 2009. The following is the resulting regression equation:
log₁₀ = 6.102 + 0.012 X - 0.129 Q₁ - 0.054 Q₂ + 0.098 Q₃
where is the estimated number of contracts in a quarter.
X is the coded quarterly value with X = 0 in the first quarter of 2005.
Q₁ is a dummy variable equal to 1 in the first quarter of a year and 0 otherwise.
Q₂ is a dummy variable equal to 1 in the second quarter of a year and 0 otherwise.
Q₃ is a dummy variable equal to 1 in the third quarter of a year and 0 otherwise.
-Referring to Table 16-12, the best interpretation of the coefficient of Q₂ (-0.054) in the regression equation is
(Multiple Choice)
4.8/5 (30)
TABLE 16-10
Business closures in Laramie, Wyoming from 2005 to 2010 were:
-Referring to Table 16-10, the value of the MAD for the second-order autoregressive model is ________.
(Short Answer)
4.9/5 (36)
TABLE 16-4
The number of cases of merlot wine sold by a Paso Robles winery in an 8-year period follows. 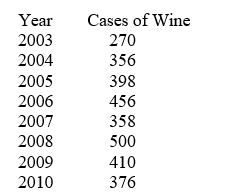 -Referring to Table 16-4, construct a centered 5-year moving average for the wine sales.
(Essay)
4.8/5 (37)
MAD is the summation of the residuals divided by the sample size.
(True/False)
4.7/5 (27)
The method of least squares is used on time-series data for
(Multiple Choice)
4.7/5 (26)
Filters
- Essay(0)
- Multiple Choice(0)
- Short Answer(0)
- True False(0)
- Matching(0)