Exam 16: Time-Series Forecasting
Exam 1: Introduction145 Questions
Exam 2: Organizing and Visualizing Data210 Questions
Exam 3: Numerical Descriptive Measures153 Questions
Exam 4: Basic Probability171 Questions
Exam 5: Discrete Probability Distributions218 Questions
Exam 6: The Normal Distribution and Other Continuous Distributions191 Questions
Exam 7: Sampling and Sampling Distributions197 Questions
Exam 8: Confidence Interval Estimation196 Questions
Exam 9: Fundamentals of Hypothesis Testing: One-Sample Tests165 Questions
Exam 10: Two-Sample Tests210 Questions
Exam 11: Analysis of Variance213 Questions
Exam 12: Chi-Square Tests and Nonparametric Tests201 Questions
Exam 13: Simple Linear Regression213 Questions
Exam 14: Introduction to Multiple Regression355 Questions
Exam 15: Multiple Regression Model Building96 Questions
Exam 16: Time-Series Forecasting168 Questions
Exam 17: Statistical Applications in Quality Management133 Questions
Exam 18: A Roadmap for Analyzing Data54 Questions
Exam 19: Questions that Involve Online Topics321 Questions
Select questions type
TABLE 16-5
The number of passengers arriving at San Francisco on the Amtrak cross-country express on 6 successive Mondays were: 60, 72, 96, 84, 36, and 48.
-Referring to Table 16-5, the number of arrivals will be smoothed with a 3-term moving average. There will be a total of ________ smoothed values.
(Short Answer)
4.7/5  (34)
(34)
TABLE 16-13
Given below is the monthly time-series data for U.S. retail sales of building materials over a specific year.
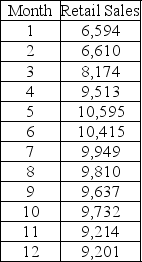 The results of the linear trend, quadratic trend, exponential trend, first-order autoregressive, second-order autoregressive and third-order autoregressive model are presented below in which the coded month for the first month is 0:
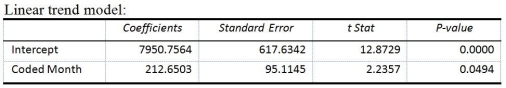
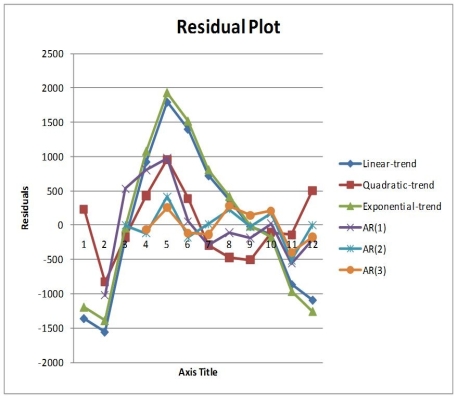 -Referring to Table 16-13, you can conclude that the quadratic term in the quadratic-trend model is statistically significant at the 5% level of significance.
(True/False)
4.9/5 (47)
Which of the following methods should not be used for short-term forecasts into the future?
(Multiple Choice)
4.8/5 (40)
TABLE 16-13
Given below is the monthly time-series data for U.S. retail sales of building materials over a specific year.
The results of the linear trend, quadratic trend, exponential trend, first-order autoregressive, second-order autoregressive and third-order autoregressive model are presented below in which the coded month for the first month is 0:
-Referring to Table 16-13, what is the exponentially smoothed value for the 12ᵗʰ month using a smoothing coefficient of W = 0.25 if the exponentially smooth value for the 10ᵗʰ and 11ᵗʰ month are 9,477.7776 and 9,411.8332, respectively?
(Short Answer)
4.9/5 (34)
TABLE 16-2
The monthly advertising expenditures of a department store chain (in $1,000,000s) were collected over the last decade. The last 14 months of this time series follows: 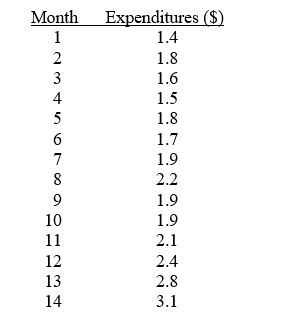 -Referring to Table 16-2, set up a scatter plot (i.e., time-series plot) with months on the horizontal X-axis.
(Essay)
4.8/5 (37)
If a time series does not exhibit a long-term trend, the method of exponential smoothing may be used to obtain short-term predictions about the future.
(True/False)
4.7/5 (38)
TABLE 16-4
The number of cases of merlot wine sold by a Paso Robles winery in an 8-year period follows. 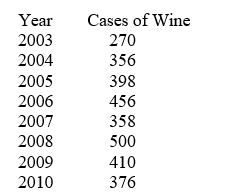 -Referring to Table 16-4, exponentially smooth the wine sales with a weight or smoothing constant of 0.2.
(Essay)
4.9/5 (31)
TABLE 16-4
The number of cases of merlot wine sold by a Paso Robles winery in an 8-year period follows.
-Referring to Table 16-4, exponential smoothing with a weight or smoothing constant of 0.2 will be used to forecast wine sales. The forecast for 2011 is ________.
(Short Answer)
4.9/5 (34)
TABLE 16-13
Given below is the monthly time-series data for U.S. retail sales of building materials over a specific year.
The results of the linear trend, quadratic trend, exponential trend, first-order autoregressive, second-order autoregressive and third-order autoregressive model are presented below in which the coded month for the first month is 0:
-Referring to Table 16-13, what is your forecast for the 13ᵗʰ month using the exponential-trend model?
(Short Answer)
4.8/5 (29)
TABLE 16-8
The manager of a marketing consulting firm has been examining his company's yearly profits. He believes that these profits have been showing a quadratic trend since 1990. He uses Microsoft Excel to obtain the partial output below. The dependent variable is profit (in thousands of dollars), while the independent variables are coded years and squared of coded years, where 1990 is coded as 0, 1991 is coded as 1, etc.
SUMMARY OUTPUT
Regression Statistics
Multiple R 0.998
R Square 0.996
Adjusted R Square 0.996
Standard Error 4.996
Observations 17
Coefficients
Intercept 35.5
Coded Year 0.45
Year Squared 1.00
-Referring to Table 16-8, the fitted value for 1990 is ________.
(Short Answer)
4.8/5 (30)
TABLE 16-13
Given below is the monthly time-series data for U.S. retail sales of building materials over a specific year.
The results of the linear trend, quadratic trend, exponential trend, first-order autoregressive, second-order autoregressive and third-order autoregressive model are presented below in which the coded month for the first month is 0:
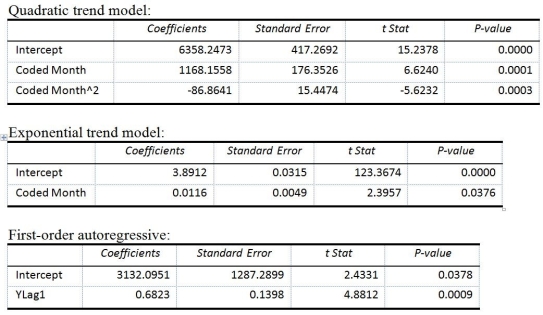
-Referring to Table 16-13, what is the p-value of the t test statistic for testing the appropriateness of the third-order autoregressive model?
(Short Answer)
4.8/5 (28)
You need to decide whether you should invest in a particular stock. You would like to invest if the price is likely to rise in the long run. You have data on the daily mean price of this stock over the past 12 months. Your best action is to
(Multiple Choice)
4.9/5 (41)
TABLE 16-13
Given below is the monthly time-series data for U.S. retail sales of building materials over a specific year.
The results of the linear trend, quadratic trend, exponential trend, first-order autoregressive, second-order autoregressive and third-order autoregressive model are presented below in which the coded month for the first month is 0:
-Referring to Table 16-13, what is the value of the t test statistic for testing the appropriateness of the second-order autoregressive model?
(Short Answer)
4.8/5 (28)
TABLE 16-13
Given below is the monthly time-series data for U.S. retail sales of building materials over a specific year.
The results of the linear trend, quadratic trend, exponential trend, first-order autoregressive, second-order autoregressive and third-order autoregressive model are presented below in which the coded month for the first month is 0:
-Referring to Table 16-13, what is your forecast for the 13ᵗʰ month using the first-order autoregressive model?
(Short Answer)
4.9/5 (29)
Based on the following scatter plot, which of the time-series components is not present in this quarterly time series? 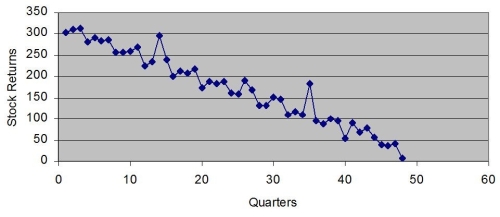
(Multiple Choice)
4.7/5 (35)
TABLE 16-13
Given below is the monthly time-series data for U.S. retail sales of building materials over a specific year.
The results of the linear trend, quadratic trend, exponential trend, first-order autoregressive, second-order autoregressive and third-order autoregressive model are presented below in which the coded month for the first month is 0:
-Referring to Table 16-13, what is the exponentially smoothed forecast for the 13ᵗʰ month using a smoothing coefficient of W = 0.25 if the exponentially smooth value for the 10ᵗʰ and 11ᵗʰ month are 9,477.7776 and 9,411.8332, respectively?
(Short Answer)
4.9/5 (23)
TABLE 16-12
A local store developed a multiplicative time-series model to forecast its revenues in future quarters, using quarterly data on its revenues during the 4-year period from 2005 to 2009. The following is the resulting regression equation:
log₁₀  = 6.102 + 0.012 X - 0.129 Q₁ - 0.054 Q₂ + 0.098 Q₃
where
= 6.102 + 0.012 X - 0.129 Q₁ - 0.054 Q₂ + 0.098 Q₃
where  is the estimated number of contracts in a quarter.
X is the coded quarterly value with X = 0 in the first quarter of 2005.
Q₁ is a dummy variable equal to 1 in the first quarter of a year and 0 otherwise.
Q₂ is a dummy variable equal to 1 in the second quarter of a year and 0 otherwise.
Q₃ is a dummy variable equal to 1 in the third quarter of a year and 0 otherwise.
-Referring to Table 16-12, in testing the significance of the coefficient of X in the regression equation (0.012) which has a p-value of 0.0000. Which of the following is the best interpretation of this result?
is the estimated number of contracts in a quarter.
X is the coded quarterly value with X = 0 in the first quarter of 2005.
Q₁ is a dummy variable equal to 1 in the first quarter of a year and 0 otherwise.
Q₂ is a dummy variable equal to 1 in the second quarter of a year and 0 otherwise.
Q₃ is a dummy variable equal to 1 in the third quarter of a year and 0 otherwise.
-Referring to Table 16-12, in testing the significance of the coefficient of X in the regression equation (0.012) which has a p-value of 0.0000. Which of the following is the best interpretation of this result?
(Multiple Choice)
5.0/5 (23)
TABLE 16-5
The number of passengers arriving at San Francisco on the Amtrak cross-country express on 6 successive Mondays were: 60, 72, 96, 84, 36, and 48.
-Referring to Table 16-5, the number of arrivals will be smoothed with a 5-term moving average. The last smoothed value will be ________.
(Short Answer)
4.8/5 (32)
TABLE 16-9
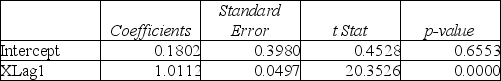
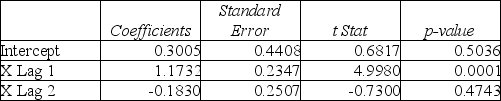
Given below are Excel outputs for various estimated autoregressive models for a company's real operating revenues (in billions of dollars) from 1985 to 2008. From the data, you also know that the real operating revenues for 2006, 2007, and 2008 are 11.7909, 11.7757 and 11.5537, respectively.
First-Order Autoregressive Model:
 Second-Order Autoregressive Model:
 Third-Order Autoregressive Model:
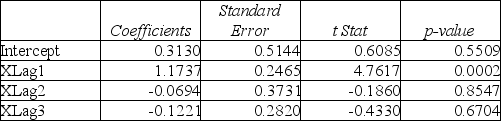 -Referring to Table 16-9, if one decides to use the Third-Order Autoregressive model, what will the predicted real operating revenue for the company be in 2011?
(Multiple Choice)
4.7/5 (27)
TABLE 16-4
The number of cases of merlot wine sold by a Paso Robles winery in an 8-year period follows.
-Referring to Table 16-4, exponential smoothing with a weight or smoothing constant of 0.4 will be used to smooth the wine sales. The value of E₅, the smoothed value for 2007 is ________.
(Short Answer)
4.8/5 (29)
Filters
- Essay(0)
- Multiple Choice(0)
- Short Answer(0)
- True False(0)
- Matching(0)