Exam 19: Questions that Involve Online Topics
Exam 1: Introduction145 Questions
Exam 2: Organizing and Visualizing Data210 Questions
Exam 3: Numerical Descriptive Measures153 Questions
Exam 4: Basic Probability171 Questions
Exam 5: Discrete Probability Distributions218 Questions
Exam 6: The Normal Distribution and Other Continuous Distributions191 Questions
Exam 7: Sampling and Sampling Distributions197 Questions
Exam 8: Confidence Interval Estimation196 Questions
Exam 9: Fundamentals of Hypothesis Testing: One-Sample Tests165 Questions
Exam 10: Two-Sample Tests210 Questions
Exam 11: Analysis of Variance213 Questions
Exam 12: Chi-Square Tests and Nonparametric Tests201 Questions
Exam 13: Simple Linear Regression213 Questions
Exam 14: Introduction to Multiple Regression355 Questions
Exam 15: Multiple Regression Model Building96 Questions
Exam 16: Time-Series Forecasting168 Questions
Exam 17: Statistical Applications in Quality Management133 Questions
Exam 18: A Roadmap for Analyzing Data54 Questions
Exam 19: Questions that Involve Online Topics321 Questions
Select questions type
Opportunity loss is the difference between the lowest profit for an event and the actual profit obtained for an action taken.
(True/False)
4.9/5  (30)
(30)
TABLE 16-2
Given below are the prices of a basket of four food items from 2006 to 2010.
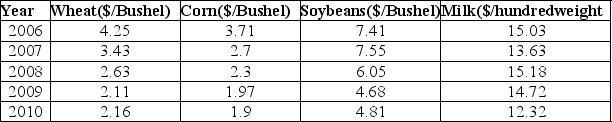 -Referring to Table 16-2, what are the simple price indices for wheat, corn, soybeans and milk, respectively, in 2009 using 2006 as the base year?
(Short Answer)
4.8/5 (41)
TABLE 8-1
A random sample of 100 stores from a large chain of 500 garden supply stores was selected to determine the mean number of lawnmowers sold at an end-of-season clearance sale. The sample results indicated a mean of 6 and a standard deviation of 2 lawnmowers sold. A 95% confidence interval (5.623 to 6.377) was established based on these results.
-Referring to Table 8-1, of all possible samples of 100 stores drawn from the population of 1,000 stores, 95% of the sample means will fall between 5.623 and 6.377 lawnmowers.
(True/False)
4.9/5 (35)
Blossom's Flowers purchases roses for sale for Valentine's Day. The roses are purchased for $10 a dozen and are sold for $20 a dozen. Any roses not sold on Valentine's Day can be sold for $5 per dozen. The owner will purchase 1 of 3 amounts of roses for Valentine's Day: 100, 200, or 400 dozen roses. Given 0.2, 0.4, and 0.4 are the probabilities for the sale of 100, 200, or 400 dozen roses, respectively, then the EVPI for buying roses is
(Multiple Choice)
4.8/5 (35)
Which of the following is an assumption required by the Analysis of Proportions (ANOP)?
(Multiple Choice)
4.9/5 (37)
The Paasche price index uses the consumption quantities in the year of interest as the weights.
(True/False)
4.9/5 (39)
To calculate expected profit under certainty, you need to have perfect information about which event will occur.
(True/False)
4.8/5 (42)
TABLE 9-1
A manufacturer produces light bulbs that have a mean life of at least 500 hours when the production process is working properly. Based on past experience, the population standard deviation is 50 hours and the light bulb life is normally distributed. The operations manager stops the production process if there is evidence that the population mean light bulb life is below 500 hours.
-Referring to Table 9-1, if you select a sample of 100 light bulbs and are willing to have a level of significance of 0.10, the probability of a Type II error is ________ if the population mean bulb life is 490 hours.
(Short Answer)
4.8/5 (39)
Using the Cook's distance statistic Dᵢ to determine influential points in a multiple regression model with k independent variable and n observations and letting Fᵥ₁ᵥ₂ denote the critical value of an F distribution with v₁ and v₂ degrees of freedom at a 0.50 level of significance, Xᵢ is an influential point if
(Multiple Choice)
4.8/5 (38)
Look at the utility function graphed below and select the type of decision maker that corresponds to the graph. 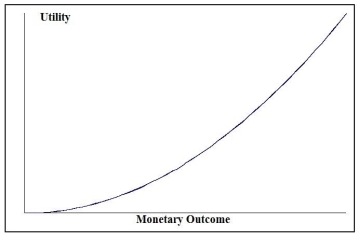
(Multiple Choice)
4.9/5 (35)
TABLE 16-2
Given below are the prices of a basket of four food items from 2006 to 2010.
-Referring to Table 16-2, what is the unweighted aggregate price index for the basket of four food items in 2008 using 2006 as the base year?
(Short Answer)
4.9/5 (39)
TABLE 16-2
Given below are the prices of a basket of four food items from 2006 to 2010.
-Referring to Table 16-2, what are the simple price indices for wheat, corn, soybeans and milk, respectively, in 2008 using 2006 as the base year?
(Short Answer)
4.9/5 (45)
TABLE 12-1
A perfume manufacturer is trying to choose between 2 magazine advertising layouts. An expensive layout would include a small package of the perfume. A cheaper layout would include a "scratch-and-sniff" sample of the product. The manufacturer would use the more expensive layout only if there is evidence that it would lead to a higher approval rate. The manufacturer presents both layouts to 5 groups and determines the approval rating from each group on both layouts. The data are given below. Use this to test whether the median difference in approval rating is different from zero in favor of the more expensive layout with a level of significance of 0.05. 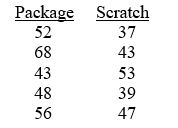 -Referring to Table 12-1, the hypotheses that should be used are
(Multiple Choice)
4.7/5 (34)
TABLE 19-5
The following payoff table shows profits associated with a set of 2 alternatives under 3 possible events. 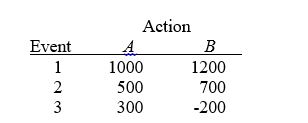 -Referring to Table 19-5, what is the EMV for Action A?
(Short Answer)
4.8/5 (36)
The Analysis of Proportion (ANOP) is more appropriate if you want to identify the group(s) that has(have) a higher or lower proportion than the overall average proportion while the chi-square test for the difference among more than two proportions is more appropriate when you just want to see if the proportions of all the different groups are the same.
(True/False)
4.8/5 (35)
TABLE 6-1
A company has 125 personal computers. The probability that any one of them will require repair on a given day is 0.15.
-Referring to Table 6-1 and assuming that the number of computers that requires repair on a given day follows a binomial distribution, compute the probability that there will be exactly 10 computers that require repair on a given day using a normal approximation.
(Essay)
4.7/5 (33)
TABLE 16-1
Given below are the average prices for three types of energy products for five consecutive years. 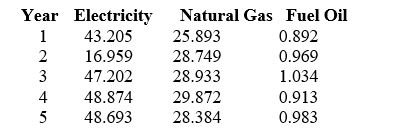 -Referring to Table 16-1, what is the Laspeyres price index for the group of three energy items in year 5 for a family that consumed 15 units of electricity, 24 units of natural gas and 200 units of fuel oil in year 1 using hear 1 as the base year?
(Short Answer)
4.7/5 (41)
TABLE 19-3
The following information is from 2 investment opportunities. 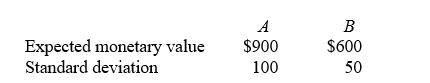 -Referring to Table 19-3, which investment has the optimal coefficient of variation?
(Multiple Choice)
4.7/5 (38)
TABLE 16-2
Given below are the prices of a basket of four food items from 2006 to 2010.
-Referring to Table 16-2, what are the simple price indices for wheat, corn, soybeans and milk, respectively, in 2007 using 2010 as the base year?
(Essay)
4.9/5 (36)
TABLE 12-2
An agronomist wants to compare the crop yield of 3 varieties of chickpea seeds. She plants all 3 varieties of the seeds on each of 5 different patches of fields. She then measures the crop yield in bushels per acre. Treating this as a randomized block design, the results are presented in the table that follows. 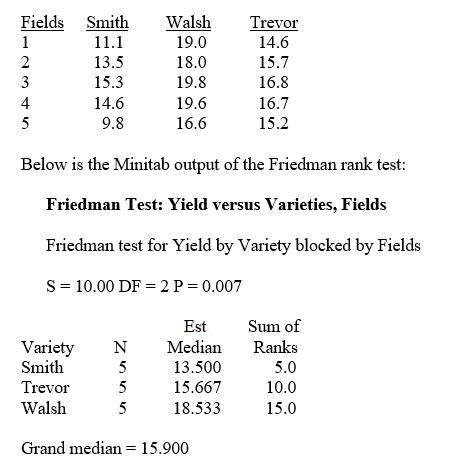 -Referring to Table 12-2, the decision made at a 0.01 level of significance on the Friedman rank test for the difference in medians implies that all 3 medians are significantly different.
(True/False)
4.9/5 (46)
Filters
- Essay(0)
- Multiple Choice(0)
- Short Answer(0)
- True False(0)
- Matching(0)