Exam 19: Questions that Involve Online Topics
Exam 1: Introduction145 Questions
Exam 2: Organizing and Visualizing Data210 Questions
Exam 3: Numerical Descriptive Measures153 Questions
Exam 4: Basic Probability171 Questions
Exam 5: Discrete Probability Distributions218 Questions
Exam 6: The Normal Distribution and Other Continuous Distributions191 Questions
Exam 7: Sampling and Sampling Distributions197 Questions
Exam 8: Confidence Interval Estimation196 Questions
Exam 9: Fundamentals of Hypothesis Testing: One-Sample Tests165 Questions
Exam 10: Two-Sample Tests210 Questions
Exam 11: Analysis of Variance213 Questions
Exam 12: Chi-Square Tests and Nonparametric Tests201 Questions
Exam 13: Simple Linear Regression213 Questions
Exam 14: Introduction to Multiple Regression355 Questions
Exam 15: Multiple Regression Model Building96 Questions
Exam 16: Time-Series Forecasting168 Questions
Exam 17: Statistical Applications in Quality Management133 Questions
Exam 18: A Roadmap for Analyzing Data54 Questions
Exam 19: Questions that Involve Online Topics321 Questions
Select questions type
TABLE 19-2
The following payoff matrix is given in dollars. 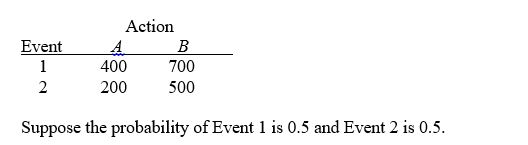 -Referring to Table 19-2, the coefficient of variation for Action A is
(Multiple Choice)
4.8/5  (34)
(34)
TABLE 9-3
A drug company is considering marketing a new local anesthetic. The effective time of the anesthetic the drug company is currently producing has a normal distribution with a mean of 7.4 minutes with a standard deviation of 1.2 minutes. The chemistry of the new anesthetic is such that the effective time should be normally distributed with the same standard deviation. The company will market the new local anesthetic as being better if there is evidence that the population mean effective time is greater than the 7.4 minutes of the current local anesthetic.
-Referring to Table 9-3, if you select a sample of 25 new local anesthetics and are willing to have a level of significance of 0.1, the confidence coefficient of the test is ________ if the population mean effective time is 8 minutes.
(Short Answer)
4.9/5 (33)
TABLE 19-5
The following payoff table shows profits associated with a set of 2 alternatives under 3 possible events. 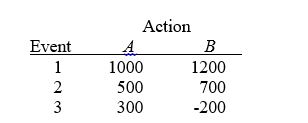 -Referring to Table 19-5, what is the opportunity loss for Action B with Event 3?
(Short Answer)
4.9/5 (37)
TABLE 9-2
An appliance manufacturer claims to have developed a compact microwave oven that consumes a population mean of no more than 250 W. From previous studies, it is believed that power consumption for microwave ovens is normally distributed with a population standard deviation of 15 W. If there is evidence that the population mean consumption is greater than 250 W, the manufacturer will be unable to make the claim.
-Referring to Table 9-2, if you select a sample of 20 compact microwave ovens and are willing to have a level of significance of 0.01, the probability of making a Type II error is ________ if the mean power consumption of all such microwave ovens is in fact 257.3 W.
(Short Answer)
5.0/5 (29)
TABLE 19-6
A student wanted to find out the optimal strategy to study for a Business Statistics exam. He constructed the following payoff table based on the mean amount of time he needed to study every week for the course and the degree of difficulty of the exam. From the information that he gathered from students who had taken the course, he concluded that there was a 40% probability that the exam would be easy.
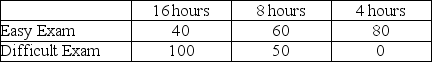 -Referring to Table 19-6, the optimal strategy using the maximin criterion is to study 8 hours per week on average for the exam.
(True/False)
4.7/5 (40)
Based on past experience, only 0.5% of the invoices of a company contain an error. Out of the 1,500 invoices that the company will issue, what is the approximate probability that more than 4 invoices will contain an error?
(Short Answer)
4.9/5 (33)
A medical doctor is involved in a $1 million malpractice suit. He can either settle out of court for $250,000 or go to court. If he goes to court and loses, he must pay $825,000 plus $175,000 in court costs. If he wins in court the plaintiffs pay the court costs. Identify the outcomes of this decision-making problem.
(Multiple Choice)
4.7/5 (35)
Look at the utility function graphed below and select the type of decision-maker that corresponds to the graph. 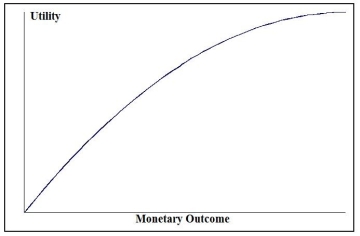
(Multiple Choice)
4.8/5 (37)
TABLE 16-1
Given below are the average prices for three types of energy products for five consecutive years. 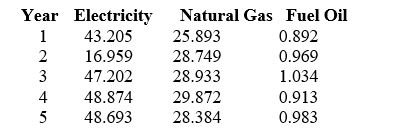 -Referring to Table 16-1, what are the simple price indices for electricity, natural gas and fuel oil, respectively, in year 2 using year 5 as the base year?
(Short Answer)
4.8/5 (29)
Which of the following is not used to determine observations that have influential effect on the fitted model?
(Multiple Choice)
4.8/5 (37)
TABLE 16-2
Given below are the prices of a basket of four food items from 2006 to 2010.
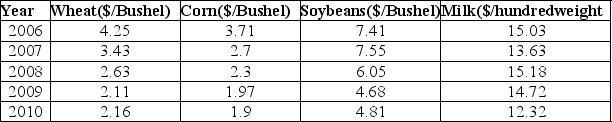 -Referring to Table 16-2, what is the unweighted aggregate price index for the basket of four food items in 2010 using 2006 as the base year?
(Short Answer)
4.8/5 (30)
TABLE 19-5
The following payoff table shows profits associated with a set of 2 alternatives under 3 possible events.
-Referring to Table 19-5, what is the return to risk ratio for Action B?
(Short Answer)
4.9/5 (39)
TABLE 7-1
Times spent studying by students in the week before final exams follow a normal distribution with standard deviation 8 hours. A random sample of 4 students was taken from a population of 50 in order to estimate the mean study time for the population of all students. Use the finite population correction.
-Referring to Table 7-1, what is the probability that the sample mean differs from the population mean by more than 3 hours?
(Short Answer)
4.8/5 (35)
TABLE 12-2
An agronomist wants to compare the crop yield of 3 varieties of chickpea seeds. She plants all 3 varieties of the seeds on each of 5 different patches of fields. She then measures the crop yield in bushels per acre. Treating this as a randomized block design, the results are presented in the table that follows. 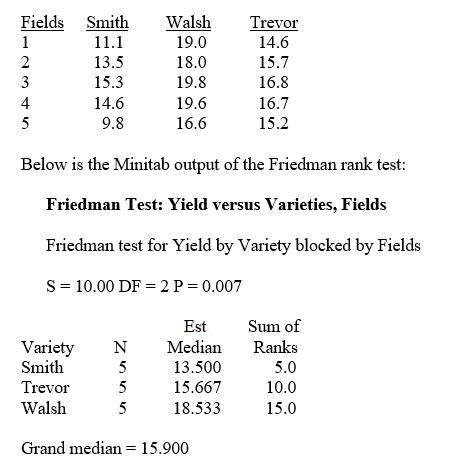 -Referring to Table 12-2, the null hypothesis for the Friedman rank test for the difference in the means should be rejected at a 0.01 level of significance.
(True/False)
4.9/5 (36)
A company that manufactures designer jeans is contemplating whether to increase its advertising budget by $1 million for next year. If the expanded advertising campaign is successful, the company expects sales to increase by $1.6 million next year. If the advertising campaign fails, the company expects sales to increase by only $400,000 next year. If the advertising budget is not increased, the company expects sales to increase by $200,000. Identify the outcomes in this decision-making problem.
(Multiple Choice)
4.8/5 (39)
TABLE 19-1
The following payoff table shows profits associated with a set of 3 alternatives under 2 possible states of nature. 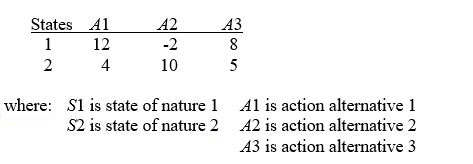 -Referring to Table 19-1, if the probability of S1 is 0.5, then the expected monetary value (EMV) for A1 is
(Multiple Choice)
4.7/5 (19)
For a price index, it is preferable to select the base period in a period of economic stability.
(True/False)
4.9/5 (38)
TABLE 19-1
The following payoff table shows profits associated with a set of 3 alternatives under 2 possible states of nature.
-Referring to Table 19-1, if the probability of S1 is 0.2 and S2 is 0.8, then the expected opportunity loss (EOL) for A1 is
(Multiple Choice)
4.8/5 (34)
TABLE 12-2
An agronomist wants to compare the crop yield of 3 varieties of chickpea seeds. She plants all 3 varieties of the seeds on each of 5 different patches of fields. She then measures the crop yield in bushels per acre. Treating this as a randomized block design, the results are presented in the table that follows.
-Referring to Table 12-2, the Friedman rank test is valid only if there is no interaction between the 5 blocks and the 3 treatment levels.
(True/False)
4.8/5 (32)
TABLE 8-2
A wealthy real estate investor wants to decide whether it is a good investment to build a high-end shopping complex in a suburban county near Chicago. His main concern is the total market value of the 3,605 houses in the suburban county. He commissioned a statistical consulting group to take a sample of 200 houses and obtained a sample mean market price of $225,000 and a sample standard deviation of $38,700. The consulting group also found out that the mean differences between market prices and appraised prices was $125,000 with a standard deviation of $3,400. Also the proportion of houses in the sample that are appraised for higher than the market prices is 0.24.
-Referring to Table 8-2, what will be the 90% confidence interval for the total difference between the market prices and appraised prices of the houses in the suburban county constructed by the consulting group?
(Essay)
4.8/5 (35)
Filters
- Essay(0)
- Multiple Choice(0)
- Short Answer(0)
- True False(0)
- Matching(0)