Exam 4: Using the Derivative
Exam 1: Functions and Change204 Questions
Exam 2: Rate of Change: the Derivative132 Questions
Exam 3: Shortcuts to Differentiation178 Questions
Exam 4: Using the Derivative94 Questions
Exam 5: Accumulated Change: the Definite Integral93 Questions
Exam 6: Antiderivatives and Applications122 Questions
Exam 7: Probability68 Questions
Exam 8: Functions of Several Variables134 Questions
Exam 9: Mathematical Modeling Using Differential Equations121 Questions
Exam 10: Geometric Series65 Questions
Select questions type
In the function y = 3sin (x) + 5, in the interval from 0 
 , at which value(s) of x does the function contain a global maximum?
(Multiple Choice)
4.8/5  (39)
(39)
The graph of the function 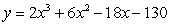 is:
A. increasing and concave up on what interval?
B. increasing and concave down on what interval?
C. decreasing and concave upon what interval?
D. decreasing and concave down on what interval?
is:
A. increasing and concave up on what interval?
B. increasing and concave down on what interval?
C. decreasing and concave upon what interval?
D. decreasing and concave down on what interval?
(Short Answer)
4.9/5 (35)
Given the cost function 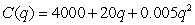 and the demand function
 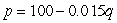 , find the value of q (to the nearest whole number) for which average cost is a minimum.
(Short Answer)
5.0/5 (42)
A flu epidemic spreads amongst a group of people according to the formula 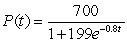 ,
where
,
where  represents the number of people that are infected by the end of day t.
A. How many people are infected by the end of the fifth day (to the nearest person)?
B. At what rate do the people become infected on day 5 (to the nearest person per day)?
represents the number of people that are infected by the end of day t.
A. How many people are infected by the end of the fifth day (to the nearest person)?
B. At what rate do the people become infected on day 5 (to the nearest person per day)?
(Short Answer)
5.0/5 (40)
The demand curve for a product is given by 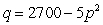 .
A. Write revenue as a function of price and take its derivative to find the price (to the nearest cent) that will maximize revenue.
B. Find the elasticity (to two decimal places) at the price you found in part A.
.
A. Write revenue as a function of price and take its derivative to find the price (to the nearest cent) that will maximize revenue.
B. Find the elasticity (to two decimal places) at the price you found in part A.
(Short Answer)
4.9/5 (27)
A biologist found that the number of Drosophila fruit flies, N(t), assumes the following growth pattern if the food source is limited: 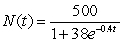 .
A. How many fruit flies were there in the beginning (to the nearest fly)?
B. At what time was the population increasing most rapidly (to the nearest day)?
C. At what rate does the number of fruit flies increase after 5 days (to the nearest fly per day)?
.
A. How many fruit flies were there in the beginning (to the nearest fly)?
B. At what time was the population increasing most rapidly (to the nearest day)?
C. At what rate does the number of fruit flies increase after 5 days (to the nearest fly per day)?
(Short Answer)
4.8/5 (42)
Daily production levels in a plant can be modeled by the function 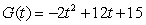 , which gives units produced at t, the number of hours since the factory opened at 8 am. Factory productivity is at a maximum at _____ am.
(Short Answer)
4.9/5 (29)
In Wilson corners, population 2000, a rumor spreads according to the logistic model. If 5 people know the rumor at 4 PM and 110 people have heard it by 5 PM, how many people will have heard the rumor by 6 PM (to the nearest person)?
(Short Answer)
4.9/5 (38)
Given the following table of production quantities with their corresponding marginal revenue and marginal cost, estimate the production level that maximizes profit. 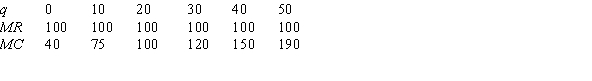
(Short Answer)
4.7/5 (38)
A normal distribution in statistics is modeled by the function 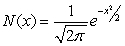 . Determine where the maximum value of the function would occur.
(Multiple Choice)
4.8/5 (43)
A disease is released into a town. The number of people, in thousands infected is modeled by the equation 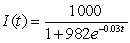 . How many people are infected after
  hours?
(Short Answer)
4.9/5 (33)
The dose response curve in the following figure is given by  , where R is percent of maximum response and x is the dose of the drug in mg. The inflection point is at (10,50) and
  . Would
  be greater or less than 7 for values of x less than 10?
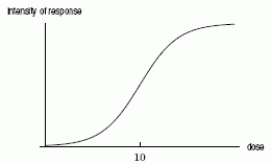
(Short Answer)
4.8/5 (41)
Which average cost function corresponds to the total cost function shown in the following figure? 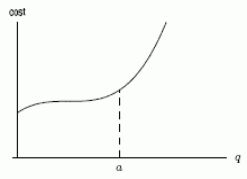
(Multiple Choice)
5.0/5 (32)
The revenue for selling q items is 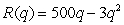 and the total cost is
  .
A. Write a function that gives total profit earned.
B. Find the quantity that maximizes profit.
.
A. Write a function that gives total profit earned.
B. Find the quantity that maximizes profit.
(Short Answer)
4.9/5 (38)
The quantity of a medication in the bloodstream t hours after it is ingested is given, in mg, by  . What is the maximum quantity of the medication in the bloodstream?
(Multiple Choice)
4.8/5 (41)
Consider the following graph of a function. Assume the entire graph is shown. How many local minima does the function have? 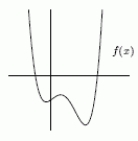
(Short Answer)
5.0/5 (42)
The total cost, C, in dollars,when producing q items is  . Calculate and interpret the marginal cost if q= 6.
(Short Answer)
4.8/5 (37)
Filters
- Essay(0)
- Multiple Choice(0)
- Short Answer(0)
- True False(0)
- Matching(0)