Exam 2: Charts and Graphs
Exam 1: Introduction to Statistics130 Questions
Exam 2: Charts and Graphs94 Questions
Exam 3: Descriptive Statistics105 Questions
Exam 4: Probability122 Questions
Exam 5: Discrete Distributions75 Questions
Exam 6: Continuous Distributions107 Questions
Exam 7: Sampling and Sampling Distributions101 Questions
Exam 8: Statistical Inference: Estimation for Single Populations75 Questions
Exam 9: Statistical Inference: Hypothesis Testing for Single Populations73 Questions
Exam 10: Statistical Inferences About Two Populations73 Questions
Exam 11: Analysis of Variance and Design of Experiments75 Questions
Exam 12: Simple Regression Analysis and Correlation75 Questions
Exam 13: Multiple Regression Analysis75 Questions
Exam 14: Building Multiple Regression Models75 Questions
Exam 15: Time-Series Forecasting and Index Numbers74 Questions
Exam 16: Analysis of Categorical Data74 Questions
Exam 17: Nonparametric Statistics79 Questions
Exam 18: Statistical Quality Control75 Questions
Exam 19: Decision Analysis77 Questions
Select questions type
A shirt production company has tracked their sales of red and blue shirts over the past few years.The graph of both is shown below. 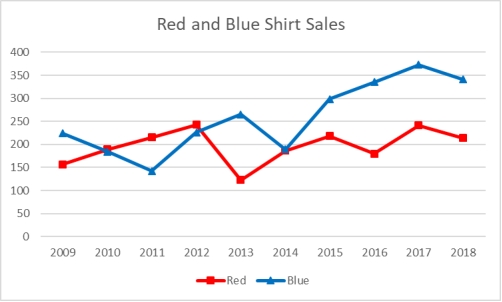 Which of the following is a true statement about the trends in sales?
(Multiple Choice)
4.7/5  (36)
(36)
Consider the following stem and leaf plot: Stem Leaf
1 0, 2, 5, 7
2 2, 3, 4, 8
3 0, 4, 6, 6, 9
4 5, 8, 8, 9
5 2, 7, 8
Suppose that a frequency distribution was developed from this, and there were 5 classes (10-under 20, 20-under 30, etc.).What would be the relative frequency of the class 20-under 30?
(Multiple Choice)
4.8/5 (34)
A frequency distribution was developed.The lower endpoint of the first class is 9.30, and the midpoint is 9.35.What is the upper endpoint of this class?
(Multiple Choice)
5.0/5 (38)
The number of phone calls arriving at a switchboard each hour has been recorded, and the following frequency distribution has been developed: Class Interval Frequency
20-under 40 30
40-under 60 45
60-under 80 80
80-under 100 45
What is the relative frequency of the second class?
(Multiple Choice)
4.9/5 (35)
In a histogram, the tallest bar represents the class with the highest cumulative frequency.
(True/False)
4.9/5 (33)
According to the following graphic, "Bent Pins" account for ___% of PCB Failures. 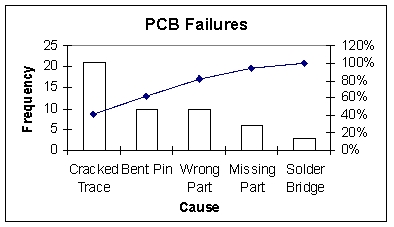
(Multiple Choice)
4.7/5 (39)
The difference between the highest number and the lowest number in a set of data is called the differential frequency.
(True/False)
4.8/5 (42)
An instructor has decided to graphically represent the grades on a test.The instructor uses a plus/minus grading system (i.e.she gives grades of A-, B+, etc.).Which of the following would provide the most information for the students?
(Multiple Choice)
4.8/5 (32)
The following class intervals for a frequency distribution were developed to provide information regarding the starting salaries for students graduating from a particular school: Salary Number of Graduates
($1,000s)
18-under 21 -
21-under 25 -
24-under 27 -
29-under 30 -
Before data was collected, someone questioned the validity of this arrangement.Which of the following represents a problem with this set of intervals?
(Multiple Choice)
4.9/5 (29)
Abel Alonzo, Director of Human Resources, is exploring employee absenteeism at the Harrison Haulers Plant during the last operating year.A review of all personnel records indicated that absences ranged from zero to twenty-nine days per employee.The following class intervals were proposed for a frequency distribution of absences: Absences Number of Employees
(Days)
0-under 5 -
5-under 10 -
10-under 15 -
20-under 25 -
25-under 30 -
Which of the following represents a problem with this set of intervals?
(Multiple Choice)
4.7/5 (31)
Sales are tracked during the past year in the graph below. 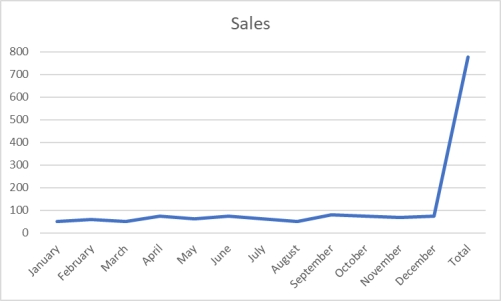 What would be the most effective strategy to allow management to more clearly discern monthly trends in sales?
(Multiple Choice)
4.9/5 (36)
The cumulative frequency for a class is 27.The cumulative frequency for the next (non-empty)class will be ___.
(Multiple Choice)
5.0/5 (43)
Consider the relative frequency distribution given below: Class Interval Relative Frequency
20-under 40 0.2
40-under 60 0.3
60-under 80 0.4
80-under 100 0.1
There were 60 numbers in the data set.How many numbers were in the interval 40-under 60?
(Multiple Choice)
4.8/5 (23)
The following graphic of residential housing data (selling price and size in square feet)indicates ___. 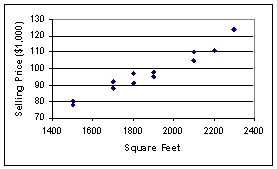
(Multiple Choice)
4.9/5 (41)
The number of phone calls arriving at a switchboard each hour has been recorded, and the following frequency distribution has been developed: Class Interval Frequency
20-under 40 30
40-under 60 45
60-under 80 80
80-under 100 45
What is the midpoint of the last class?
(Multiple Choice)
4.9/5 (30)
A retail shoe company would like to consider key elements that might impact the sales related a specific store's location in the town.If placed on a scatter plot, which two variables would be helpful in helping management with this information?
(Multiple Choice)
4.9/5 (32)
The following graphic of cigarettes smoked (sold)per capita (CIG)and deaths per 100K population from lung cancer (LUNG)indicates _________ 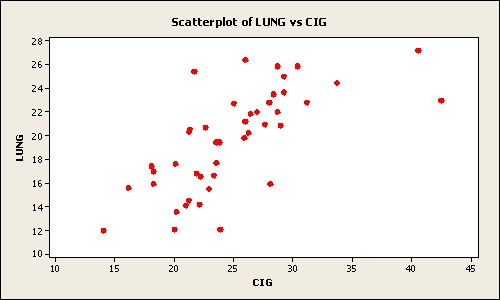
(Multiple Choice)
4.9/5 (37)
Time-series data should be shown from oldest time period to the most recent.
(True/False)
4.8/5 (39)
Filters
- Essay(0)
- Multiple Choice(0)
- Short Answer(0)
- True False(0)
- Matching(0)