Exam 2: Charts and Graphs
Exam 1: Introduction to Statistics130 Questions
Exam 2: Charts and Graphs94 Questions
Exam 3: Descriptive Statistics105 Questions
Exam 4: Probability122 Questions
Exam 5: Discrete Distributions75 Questions
Exam 6: Continuous Distributions107 Questions
Exam 7: Sampling and Sampling Distributions101 Questions
Exam 8: Statistical Inference: Estimation for Single Populations75 Questions
Exam 9: Statistical Inference: Hypothesis Testing for Single Populations73 Questions
Exam 10: Statistical Inferences About Two Populations73 Questions
Exam 11: Analysis of Variance and Design of Experiments75 Questions
Exam 12: Simple Regression Analysis and Correlation75 Questions
Exam 13: Multiple Regression Analysis75 Questions
Exam 14: Building Multiple Regression Models75 Questions
Exam 15: Time-Series Forecasting and Index Numbers74 Questions
Exam 16: Analysis of Categorical Data74 Questions
Exam 17: Nonparametric Statistics79 Questions
Exam 18: Statistical Quality Control75 Questions
Exam 19: Decision Analysis77 Questions
Select questions type
Consider the following frequency distribution: Class Interval Frequency
100-under 200 25
200-under 300 45
300-under 400 30
What is the midpoint of the first class?
(Multiple Choice)
4.8/5  (31)
(31)
Sales are tracked during the past year in the graph below. 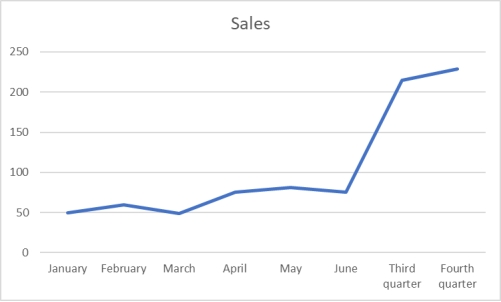 Management is pleased to see the growth in sales at the end of the year.Why would this be an incorrect conclusion?
(Multiple Choice)
4.7/5 (41)
The staff of Mr.Wayne Wertz, VP of Operations at Portland Peoples Bank, prepared a frequency histogram of waiting time for walk-in customers. 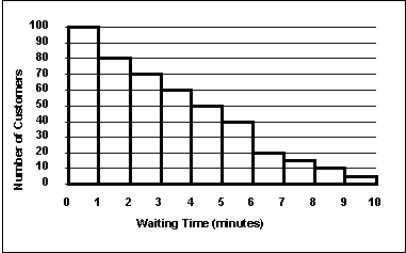 Approximately ___ walk-in customers waited at least 7 minutes.
(Multiple Choice)
4.9/5 (29)
One rule that must always be followed in constructing frequency distributions is that the adjacent classes must overlap.
(True/False)
4.8/5 (32)
A cross tabulation is a graph that separately displays the frequency counts for two variables.
(True/False)
4.8/5 (33)
Consider the following stem and leaf plot: Stem Leaf
1 0, 2, 5, 7
2 2, 3, 4, 8
3 0, 4, 6, 6, 9
4 5, 8, 8, 9
5 2, 7, 8
Suppose that a frequency distribution was developed from this, and there were 5 classes (10-under 20, 20-under 30, etc.).What was the lowest number in the data set?
(Multiple Choice)
4.7/5 (32)
The following represent the ages of students in a class: 19, 23, 21, 19, 19, 20, 22, 31, 21, 20
If a stem and leaf plot were to be developed from this, how many stems would there be?
(Multiple Choice)
4.9/5 (30)
A shirt production company has tracked their production since the company started in 1999.The graph of their annual production is shown. 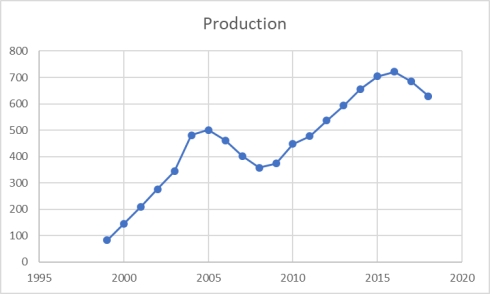 During these years, production has generally _______________.
(Multiple Choice)
4.9/5 (26)
To compare two series of data during the same time period, the graph should show the first and then show the second after that, all in one line.
(True/False)
4.9/5 (37)
A person has decided to construct a frequency distribution for a set of data containing 60 numbers.The lowest number is 23 and the highest number is 68.If 5 classes are used, the class width should be approximately ___.
(Multiple Choice)
4.8/5 (38)
Consider the following stem and leaf plot: Stem Leaf
1 0, 2, 5, 7
2 2, 3, 4, 8
3 0, 4, 6, 6, 9
4 5, 8, 8, 9
5 2, 7, 8
Suppose that a frequency distribution was developed from this, and there were 5 classes (10-under 20, 20-under 30, etc.).What is the cumulative frequency for the 30-under 40 class interval?
(Multiple Choice)
4.9/5 (33)
Consider the relative frequency distribution given below: Class Interval Relative Frequency
20-under 40 0.2
40-under 60 0.3
60-under 80 0.4
80-under 100 0.1
There were 60 numbers in the data set.How many numbers were in the interval 20-under 40?
(Multiple Choice)
4.9/5 (36)
Consider the following frequency distribution: Class Interval Frequency
10-under 20 15
20-under 30 25
30-under 40 10
What is the cumulative frequency of the second class interval?
(Multiple Choice)
4.9/5 (40)
Each day, the office staff at Oasis Quick Shop prepares a frequency distribution and an ogive of sales transactions by dollar value of the transactions.Saturday's cumulative frequency ogive follows: 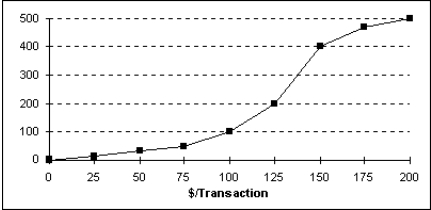 The total number of sales transactions on Saturday was ___.
(Multiple Choice)
4.7/5 (39)
Filters
- Essay(0)
- Multiple Choice(0)
- Short Answer(0)
- True False(0)
- Matching(0)