Exam 6: Elasticity
Exam 1: First Principles246 Questions
Exam 2: Economic Models: Trade-Offs and Trade72 Questions
Exam 3: Supply and Demand266 Questions
Exam 4: Consumer and Producer Surplus196 Questions
Exam 5: Price Controls and Quotas: Meddling With Markets203 Questions
Exam 6: Elasticity329 Questions
Exam 7: Taxes284 Questions
Exam 8: International Trade265 Questions
Exam 9: Decision Making by Individuals and Firms209 Questions
Exam 10: The Rational Consumer477 Questions
Exam 11: Behind the Supply Curve: Inputs and Costs282 Questions
Exam 12: Perfect Competition and the Supply Curve320 Questions
Exam 13: Monopoly258 Questions
Exam 14: Oligopoly212 Questions
Exam 15: Monopolistic Competition and Product Differentiation223 Questions
Exam 16: Externalities234 Questions
Exam 17: Public Goods and Common Resources237 Questions
Exam 18: The Economics of the Welfare State144 Questions
Exam 19: Factor Markets and the Distribution of Income241 Questions
Exam 20: Uncertainty, Risk, and Private Information199 Questions
Select questions type
A men's tie store sold an average of 30 ties per day when the price was $5 per tie.The same store sold 60 of the same ties per day when the price was $3 per tie.In this case, the price elasticity of demand (using the midpoint method) is:
A.greater than zero but less than 1.
B.equal to 1.
C.greater than 1 but less than 3.
D.greater than 3.
(Essay)
4.9/5  (32)
(32)
If the price of chocolate-covered peanuts increases and the demand for strawberry licorice twists increases, this indicates that these two goods are:
A.complementary goods.
B.normal goods.
C.inferior goods.
D.substitute goods.
(Essay)
4.8/5 (29)
Sometimes airlines raise ticket prices as the flight departure date approaches in the hope of increasing revenue.The airlines raise their prices on the assumption that:
A.consumer demand becomes more price-elastic as departure time approaches.
B.consumer demand becomes less price-elastic as departure time approaches.
C.consumers are not aware of airline prices.
D.consumer demand is unrelated to prices.
(Essay)
4.8/5 (41)
Figure: The Demand Curve for Oil
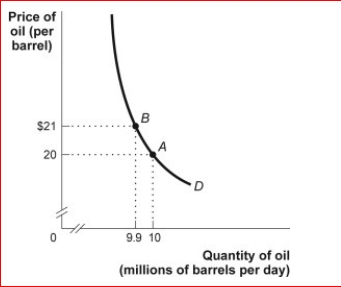
 (Figure: The Demand Curve for Oil) Look at the figure The Demand Curve for Oil.In the figure, demand is price ________ between $20 and $21, since total revenue when
the price _.
A.elastic; increases; decreases
B.inelastic; stays the same; decreases
C.elastic; decreases; increases
D.inelastic; increases; increases
(Figure: The Demand Curve for Oil) Look at the figure The Demand Curve for Oil.In the figure, demand is price ________ between $20 and $21, since total revenue when
the price _.
A.elastic; increases; decreases
B.inelastic; stays the same; decreases
C.elastic; decreases; increases
D.inelastic; increases; increases
(Essay)
4.8/5 (36)
Given a price increase for any good, the price effect on revenue is always larger than the quantity effect on revenue.
(True/False)
4.9/5 (37)
If two goods are complements, their cross-price elasticity of demand should be:
A.less than 0.
B.equal to 0.
C.positive yet almost equal to 0.
D.greater than 0.
(Essay)
4.8/5 (37)
Figure: Supply Curves
(Figure: Supply Curves) Look at the figure Supply Curves.Which graph shows a perfectly elastic supply curve?
(Multiple Choice)
4.9/5 (40)
If two goods are complements, their cross-price elasticity of demand should be:
A.less than 0.
B.equal to 0.
C.positive yet almost equal to 0.
D.greater than 0.
(Essay)
4.7/5 (33)
Figure: The Demand for Shirts 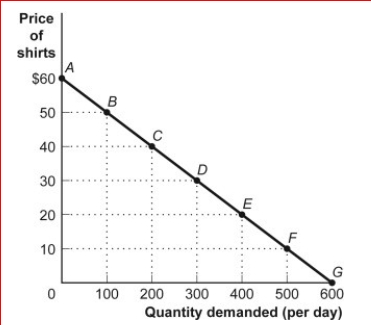
 (Figure: The Demand for Shirts) Look again at the figure The Demand for Shirts.The price elasticity of demand for the segment EF, using the midpoint method, is:
(Multiple Choice)
4.9/5 (40)
If the quantity supplied responds substantially to a relatively small change in price, supply is:
A.price-elastic.
B.price-inelastic.
C.negatively sloped.
D.insensitive to changes in price.
(Essay)
4.9/5 (42)
An important determinant of the price elasticity of demand is the:
(Multiple Choice)
4.8/5 (32)
If the income elasticity of demand for a good is negative, the good is said to be:
A.an inferior good.
B.a negative good.
C.a positive good.
D.a normal good.
(Essay)
4.9/5 (41)
Suppose at a price of $10 the quantity demanded is 100.When the price falls to $8, the quantity demanded increases to 130.The price elasticity of demand (using the midpoint formula) between the prices of $10 and $8 is approximately:
(Multiple Choice)
4.7/5 (37)
Figure: The Demand for Notebook Computers
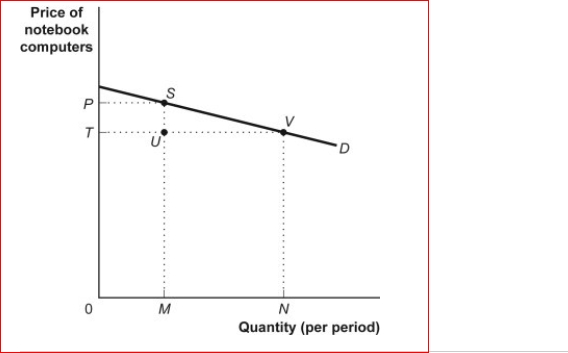 (Figure: Demand for Notebook Computers) Look again at the figure The Demand for Notebook Computers.Total revenue at point V equals the:
A.area 0TVN.
B.area 0PSVN.
C.distance 0T.
D.distance NV.
(Figure: Demand for Notebook Computers) Look again at the figure The Demand for Notebook Computers.Total revenue at point V equals the:
A.area 0TVN.
B.area 0PSVN.
C.distance 0T.
D.distance NV.
(Essay)
4.8/5 (33)
For a normal good, the income elasticity of demand will be:
(Multiple Choice)
4.9/5 (35)
Figure: The Market for e-Books
(Figure: The Market for e-Books) If the price of e-Books decreases from $6 to $4, total revenue changes from _______ to _______, which means that demand is _.
A.$240; $200; elastic
B.$240; $200; inelastic
C.$180; $240; elastic
D.$40 to $50; inelastic
(Essay)
4.8/5 (35)
Figure: The Demand for e-Books
(Figure: The Demand for e-Books) Look again at the figure The Demand for e-Books.What is the price elasticity of demand (using the midpoint method) when the price increases from $6 to $8?
A.5/9
B.1/2
C.1
D.2/3
(Essay)
4.8/5 (37)
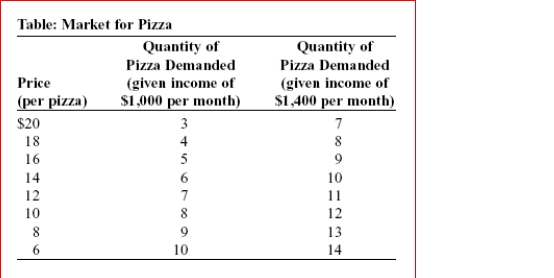 (Table: Market for Pizza) Look at the table Market for Pizza.The price elasticity of demand for pizza between the prices of $14 and $12 per pizza when income is $1,000 per month is (use the midpoint method):
(Multiple Choice)
4.9/5 (35)
The price elasticity of demand for lettuce has been estimated to be 2.58.If an insect infestation destroys 10% of the nation's lettuce crop, how will that affect total revenue from lettuce, all other things unchanged?
A.Total revenue will remain unchanged.
B.Total revenue will fall.
C.Total revenue will rise.
D.Not enough information is given to answer the question.
(Essay)
4.9/5 (31)
The price elasticity of demand for fresh zucchini has been estimated to be 2.25.A new irrigation system yields a 25% increase in the nation's crop of fresh zucchini.Which of the following best describes how this will affect total expenditures on zucchini, all other things equal?
A.Total expenditures will remain unchanged.
B.Total expenditures will fall.
C.Total expenditures will rise.
D.Not enough information is given to answer the question.
(Essay)
4.7/5 (39)
Filters
- Essay(0)
- Multiple Choice(0)
- Short Answer(0)
- True False(0)
- Matching(0)