Exam 6: Elasticity
Exam 1: First Principles246 Questions
Exam 2: Economic Models: Trade-Offs and Trade72 Questions
Exam 3: Supply and Demand266 Questions
Exam 4: Consumer and Producer Surplus196 Questions
Exam 5: Price Controls and Quotas: Meddling With Markets203 Questions
Exam 6: Elasticity329 Questions
Exam 7: Taxes284 Questions
Exam 8: International Trade265 Questions
Exam 9: Decision Making by Individuals and Firms209 Questions
Exam 10: The Rational Consumer477 Questions
Exam 11: Behind the Supply Curve: Inputs and Costs282 Questions
Exam 12: Perfect Competition and the Supply Curve320 Questions
Exam 13: Monopoly258 Questions
Exam 14: Oligopoly212 Questions
Exam 15: Monopolistic Competition and Product Differentiation223 Questions
Exam 16: Externalities234 Questions
Exam 17: Public Goods and Common Resources237 Questions
Exam 18: The Economics of the Welfare State144 Questions
Exam 19: Factor Markets and the Distribution of Income241 Questions
Exam 20: Uncertainty, Risk, and Private Information199 Questions
Select questions type
The price elasticity of a good will tend to be larger:
A.the longer the relevant time period.
B.the fewer number of substitute goods available.
C.if it is a staple.
D.if it is relatively inexpensive.
(Essay)
4.7/5  (34)
(34)
A local restaurant has estimated that the price elasticity of demand for meals is equal to 2.If the restaurant increases menu prices by 5%, they can expect the number of customers to decrease by ________and total revenue to _.
(Multiple Choice)
4.8/5 (44)
We note that the price of pretzels increases and the demand for tortilla chips decreases, so we can assume that these two goods are:
A.unrelated goods.
B.inferior goods.
C.complementary goods.
D.substitute goods.
(Essay)
4.8/5 (31)
If the price of chocolate-covered peanuts decreases from $1.10 to $0.95 and the quantity demanded increases from 190 bags to 215 bags, then the price elasticity of demand (using the midpoint method) is:
(Multiple Choice)
4.7/5 (40)
The price elasticity of demand for gasoline in the short run has been estimated to be 0.1.If a war in the Middle East causes the price of oil (from which gasoline is made) to increase, how will that affect total expenditures on gasoline in the short run, all other things equal?
A.Demand will stay the same, but total expenditures will fall.
B.Demand will decrease, but total expenditures will rise.
C.Total expenditures will remain unchanged.
D.Demand will not change much, but total expenditures will rise.
(Essay)
4.7/5 (30)
If the price of chocolate-covered peanuts increases and the demand for strawberry-flavored soft drinks decreases, this indicates that these two goods are:
A.unrelated goods.
B.complementary goods.
C.inferior goods.
D.substitute goods.
(Essay)
4.8/5 (35)
Figure: The Demand for Shirts 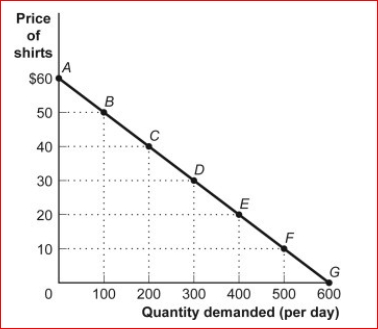
 (Figure: The Demand for Shirts) Look at the figure The Demand for Shirts.Using the midpoint method, the price elasticity of demand for the segment DE is:
(Multiple Choice)
4.9/5 (29)
Which of the following statements is true?
A.When the income elasticity of demand is positive, the good is an inferior good.
B.When the income elasticity of demand is negative, the good is a normal good.
C.Income elasticity of demand measures how much the demand for a good is affected by changes in consumers' incomes.
D.Income elasticity of demand measures the effect of the change in one good's price on the quantity demanded of the other good.
(Essay)
5.0/5 (34)
Figure: Supply Curves 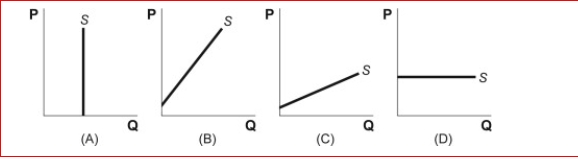 (Figure: Supply Curves) Look at the figure Supply Curves.Which graph shows a perfectly inelastic supply curve?
(Multiple Choice)
4.8/5 (33)
One would expect to see the supply become more price as harvest season
approaches and crops are being brought in from the fields.
A.elastic
B.inelastic
C.unit-elastic
D.inferior
(Essay)
4.8/5 (33)
If the price elasticity of supply is less than 1, then supply is:
(Multiple Choice)
4.9/5 (37)
Figure: The Demand Curve for Bridge Crossings
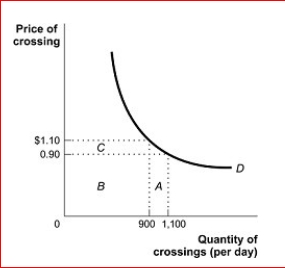
 (Figure: The Demand Curve for Bridge Crossings) Look at the figure The Demand Curve for Bridge Crossings.The price elasticity of demand between $0.90 and $1.10 in the figure is:
A.price-elastic, since the price elasticity is less than 1.
B.price unit-elastic, since the price elasticity is equal to 1.
C.price-elastic, since the price elasticity is a negative number.
D.price-inelastic, since the price elasticity is less than 1.
(Figure: The Demand Curve for Bridge Crossings) Look at the figure The Demand Curve for Bridge Crossings.The price elasticity of demand between $0.90 and $1.10 in the figure is:
A.price-elastic, since the price elasticity is less than 1.
B.price unit-elastic, since the price elasticity is equal to 1.
C.price-elastic, since the price elasticity is a negative number.
D.price-inelastic, since the price elasticity is less than 1.
(Essay)
4.8/5 (31)
Suppose the price of cereal rose by 25% and the quantity of milk sold decreased by 50%.We know that the:
A.cross-price elasticity between cereal and milk is -2.
B.cross-price elasticity between cereal and milk is -0.5.
C.price elasticity of demand for milk is 2.
D.cross-price elasticity of demand for milk is 2.
(Essay)
4.9/5 (36)
When actually calculated for a normal demand curve, the price elasticity of demand will be:
A.always positive.
B.always greater than 1.
C.usually equal to
D.1.always negative.
(Essay)
4.7/5 (34)
The publisher of an economics textbook finds that when the book's price is lowered from $70 to $60, sales rise from 10,000 to 15,000.Using the midpoint method, the price elasticity of demand is:
(Multiple Choice)
4.9/5 (38)
Figure: The Market for e-Books
(Figure: The Market for e-Books) Look at the figure The Market for e-Books.Which of the following statements is correct?
A.The demand schedule is less elastic when the price increases from $4 to $6 than when it increases from $6 to $8.
B.The demand schedule is more elastic when the price increases from $4 to $6 than when it increases from $6 to $8.
C.The demand schedule has the same elasticity when the price increases from $4 to $6 as when it increases from $6 to $8.
D.The demand schedule is unit-elastic when the price increases from $4 to $6 and when it increases from $6 to $8.
(Essay)
4.8/5 (32)
Using the midpoint method to calculate the price elasticity of demand eliminates the problem of computing:
A.different elasticities, depending on whether price decreases or increases.
B.different elasticities, because price and quantity are inversely related on the demand curve.
C.total revenue when price falls and demand is inelastic.
D.total revenue when price falls and demand is elastic.
(Essay)
4.7/5 (27)
Figure: Demand Curves 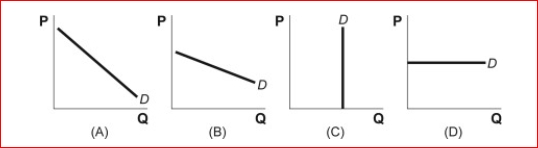
 (Figure: Demand Curves) Look again at the figure Demand Curves.Which graph shows a perfectly inelastic demand curve?
(Multiple Choice)
4.8/5 (28)
Suppose the price elasticity of demand for oranges is 1.8.If a fall frost destroys one-third of the nation's orange crop, how will that affect total revenue from oranges, all other things unchanged?
A.Total revenue will rise.
B.Total revenue will fall.
C.Total revenue will remain unchanged.
D.Not enough information is given to answer the question.
(Essay)
4.8/5 (31)
The price of notebooks is $5, and at that price consumers demand 12 notebooks.If the price rises to $7, consumers will decrease consumption to 4 notebooks.Using the midpoint formula, what is the price elasticity of demand for notebooks?
(Multiple Choice)
4.9/5 (37)
Filters
- Essay(0)
- Multiple Choice(0)
- Short Answer(0)
- True False(0)
- Matching(0)