Exam 17: Optimization Models with Uncertainty
Exam 1: Introduction to Business Analytics50 Questions
Exam 2: Analytics on Spreadsheets52 Questions
Exam 3: Visualizing and Exploring Data50 Questions
Exam 4: Descriptive Statistical Measures79 Questions
Exam 5: Probability Distributions and Data Modeling50 Questions
Exam 6: Sampling and Estimation59 Questions
Exam 7: Statistical Inference50 Questions
Exam 8: Predictive Modeling and Analysis64 Questions
Exam 9: Regression Analysis50 Questions
Exam 10: Forecasting Techniques55 Questions
Exam 11: Simulation and Risk Analysis50 Questions
Exam 12: Introduction to Data Mining53 Questions
Exam 13: Linear Optimization50 Questions
Exam 14: Applications of Linear Optimization62 Questions
Exam 15: Integer Optimization50 Questions
Exam 16: Nonlinear and Non-Smooth Optimization66 Questions
Exam 17: Optimization Models with Uncertainty50 Questions
Exam 18: Decision Analysis50 Questions
Select questions type
Use the table below to answer the following question(s).
Below is a spreadsheet for Stone Age Surfboards.
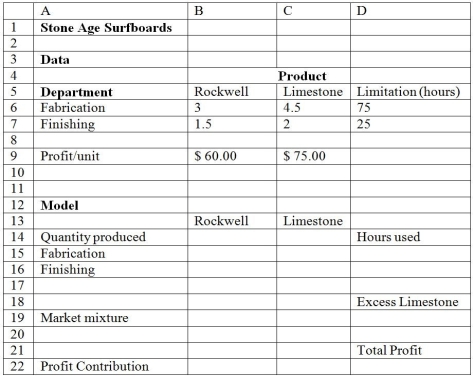 Assume that the finishing time for a pair of Rockwell surfboards is triangular with a minimum value of 1.4, a most likely value of 1.5, and a maximum value of 1.8 and that finishing time for a pair of Limestone surfboards is also triangular with a minimum value of 1.8, a most likely value of 2.0, and a maximum value of 2.4.The number of trials per simulation is equal to 5000.
-What is the coefficient of variation obtained from the simulation results?
Assume that the finishing time for a pair of Rockwell surfboards is triangular with a minimum value of 1.4, a most likely value of 1.5, and a maximum value of 1.8 and that finishing time for a pair of Limestone surfboards is also triangular with a minimum value of 1.8, a most likely value of 2.0, and a maximum value of 2.4.The number of trials per simulation is equal to 5000.
-What is the coefficient of variation obtained from the simulation results?
(Multiple Choice)
4.8/5  (32)
(32)
Use the table below to answer the following question(s).
The Atlas Movies Theater has repriced their ticket rates to maximize revenues.They have three classes of tickets: Classic, Silver, and Gold.The table below provides information on the average ticket sales, revenue and price elasticity on demand.They have a total seating capacity of 300.The table also provides the new price for the three classes obtained using Solver.
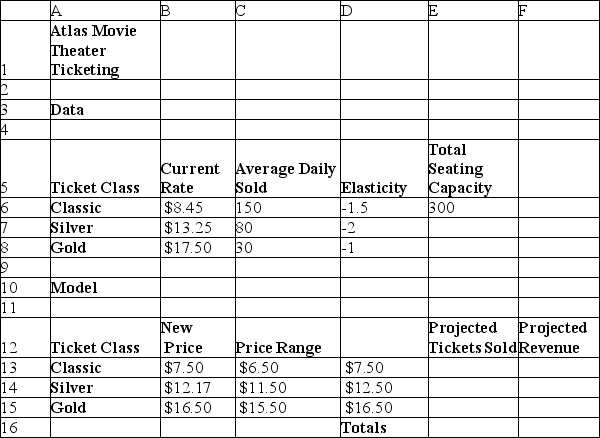 Assume the distributions of elasticities for three classes of tickets are uniform with minimum and maximum values equal to 75% and 125% of their estimated values, respectively.Under this assumption, use Monte Carlo simulation to answer the following questions.The model is simulated for 10,000 trials.
-Which of the following cells is defined as the output cell?
Assume the distributions of elasticities for three classes of tickets are uniform with minimum and maximum values equal to 75% and 125% of their estimated values, respectively.Under this assumption, use Monte Carlo simulation to answer the following questions.The model is simulated for 10,000 trials.
-Which of the following cells is defined as the output cell?
(Multiple Choice)
4.8/5 (35)
Use the table below to answer the following question(s).
The Atlas Movies Theater has repriced their ticket rates to maximize revenues.They have three classes of tickets: Classic, Silver, and Gold.The table below provides information on the average ticket sales, revenue and price elasticity on demand.They have a total seating capacity of 300.The table also provides the new price for the three classes obtained using Solver.
Assume the distributions of elasticities for three classes of tickets are uniform with minimum and maximum values equal to 75% and 125% of their estimated values, respectively.Under this assumption, use Monte Carlo simulation to answer the following questions.The model is simulated for 10,000 trials.
-What is the coefficient of variation obtained from the simulation results?
(Multiple Choice)
4.8/5 (38)
Use the table below to answer the following question(s).
Below is the spreadsheet for a project selection model.
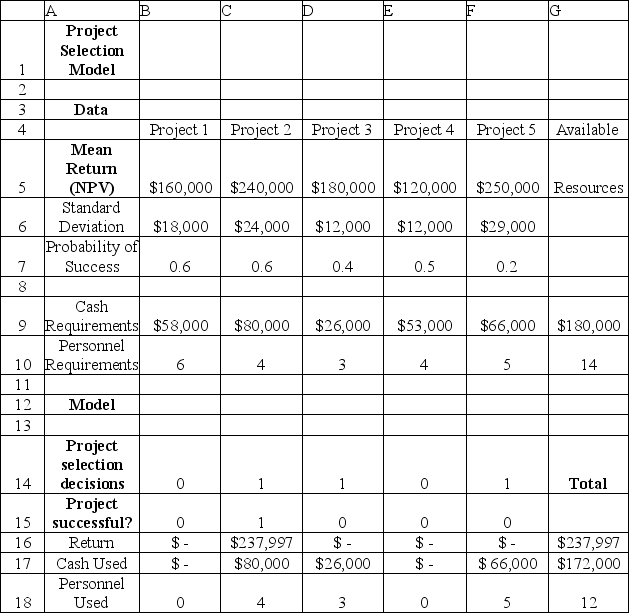 -Which of the following cells is defined as the output cell?
(Multiple Choice)
4.9/5 (34)
Use the table below to answer the following question(s).
Below is the spreadsheet for a project selection model.
-A value at risk measure considers the magnitude of the violation when the constraint is not satisfied.
(True/False)
4.9/5 (32)
Use the table below to answer the following question(s).
Below is the spreadsheet for an economic order quantity model.
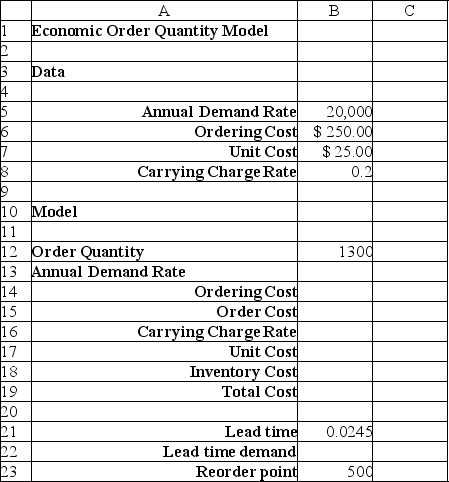 Assume that the distribution of demand is normal with a mean of 20,000 and standard deviation of 2,000.
-What is the value of standard deviation obtained from the simulation results?
Assume that the distribution of demand is normal with a mean of 20,000 and standard deviation of 2,000.
-What is the value of standard deviation obtained from the simulation results?
(Multiple Choice)
4.9/5 (30)
Use the table below to answer the following question(s).
Below is the spreadsheet for a portfolio allocation model.
![Use the table below to answer the following question(s). Below is the spreadsheet for a portfolio allocation model. Assume that the distributions of life insurance annual return is uniform distribution with minimum 4% and maximum 6%, bond mutual funds annual return is normal with mean 7% and standard deviation 1%, stock mutual funds annual return is lognormal with mean 11% and standard deviation 4%. -What is the value of the mean obtained from the simulation results for maximizing the total expected return? [Hint: Choose the approximate value.]](https://storage.examlex.com/TB3611/11ea30b2_921f_544c_b0fd_25a805260963_TB3611_00_TB3611_00_TB3611_00_TB3611_00_TB3611_00.jpg) Assume that the distributions of life insurance annual return is uniform distribution with minimum 4% and maximum 6%, bond mutual funds annual return is normal with mean 7% and standard deviation 1%, stock mutual funds annual return is lognormal with mean 11% and standard deviation 4%.
-What is the value of the mean obtained from the simulation results for maximizing the total expected return? [Hint: Choose the approximate value.]
Assume that the distributions of life insurance annual return is uniform distribution with minimum 4% and maximum 6%, bond mutual funds annual return is normal with mean 7% and standard deviation 1%, stock mutual funds annual return is lognormal with mean 11% and standard deviation 4%.
-What is the value of the mean obtained from the simulation results for maximizing the total expected return? [Hint: Choose the approximate value.]
(Multiple Choice)
4.8/5 (36)
Use the table below to answer the following question(s).
Below is the spreadsheet for an economic order quantity model.
Assume that the distribution of demand is normal with a mean of 20,000 and standard deviation of 2,000.
-What is the reorder point required to attain a 95% service level?
(Multiple Choice)
4.8/5 (41)
Filters
- Essay(0)
- Multiple Choice(0)
- Short Answer(0)
- True False(0)
- Matching(0)