Exam 3: Visualizing and Exploring Data
Exam 1: Introduction to Business Analytics50 Questions
Exam 2: Analytics on Spreadsheets52 Questions
Exam 3: Visualizing and Exploring Data50 Questions
Exam 4: Descriptive Statistical Measures79 Questions
Exam 5: Probability Distributions and Data Modeling50 Questions
Exam 6: Sampling and Estimation59 Questions
Exam 7: Statistical Inference50 Questions
Exam 8: Predictive Modeling and Analysis64 Questions
Exam 9: Regression Analysis50 Questions
Exam 10: Forecasting Techniques55 Questions
Exam 11: Simulation and Risk Analysis50 Questions
Exam 12: Introduction to Data Mining53 Questions
Exam 13: Linear Optimization50 Questions
Exam 14: Applications of Linear Optimization62 Questions
Exam 15: Integer Optimization50 Questions
Exam 16: Nonlinear and Non-Smooth Optimization66 Questions
Exam 17: Optimization Models with Uncertainty50 Questions
Exam 18: Decision Analysis50 Questions
Select questions type
Peige, a stock broker, has data consisting of price, price/earnings ratio, and market capitalization for seven different stocks on one particular day.She wishes to plot these three variables in two dimensions.Which of the following charts must Peige use?
Free
(Multiple Choice)
4.8/5  (32)
(32)
Correct Answer: Verified
C
Use the data given below to answer the following question(s).
Following is an extract from the Cost per Order Database of Grogtes LLC.
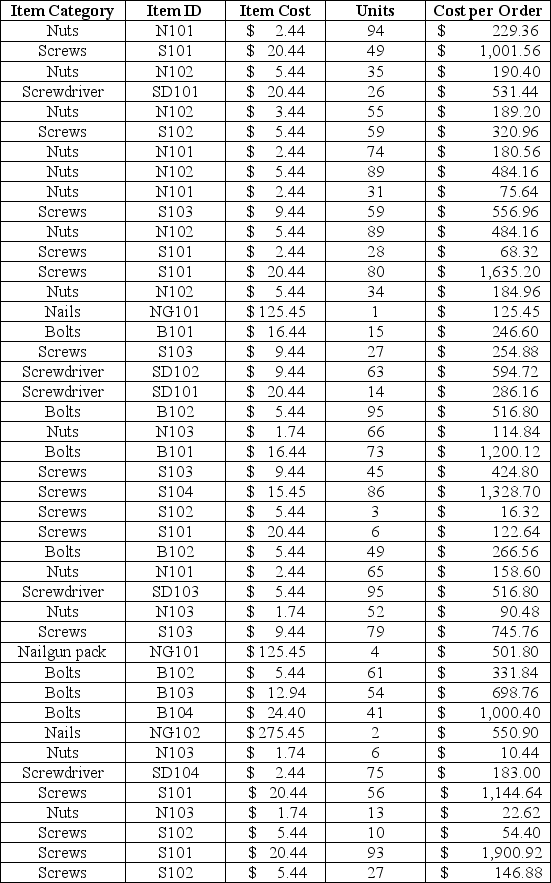 -Which of the following does the 38th percentile of the costs per order indicate?
Free
(Multiple Choice)
4.9/5 (40)
Correct Answer:Verified
B
Philip wishes to understand the relative proportion of each data source to the total.Which of the following charts must Philip use?
Free
(Multiple Choice)
4.8/5 (40)
Correct Answer:Verified
A
Use the data given below to answer the following question(s).
Following is the purchase order database of 'The Chef Says So', a restaurant in New York, over the last quarter (April-June).
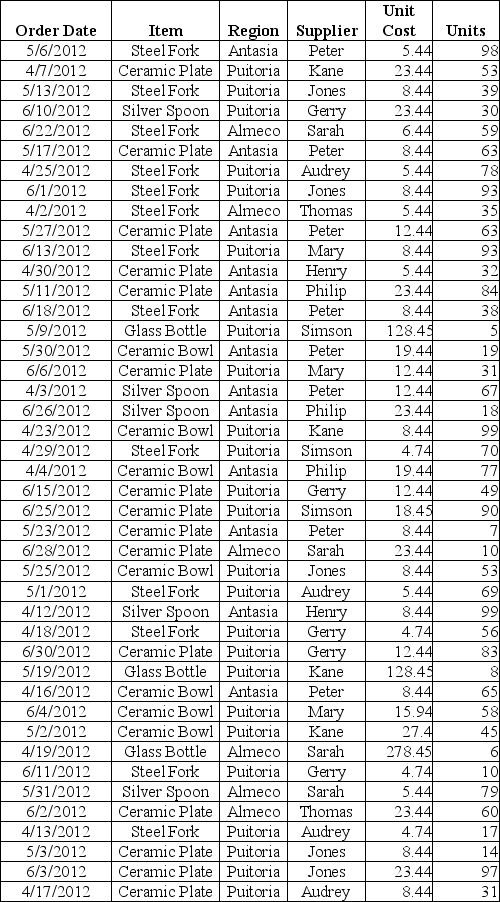 -AutoFilter creates filtering criteria based on the type of data being filtered.
(True/False)
4.9/5 (38)
Use the data given below to answer the following question(s).
Following is an extract from the Employee Payroll Database of HFR Informatics Inc.
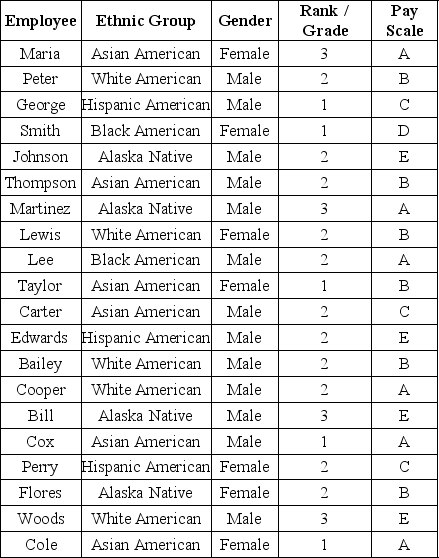 -While constructing a histogram, how is group width calculated?
(Multiple Choice)
4.8/5 (39)
Use the data given below to answer the following question(s).
Following is an extract from the Cost per Order Database of Grogtes LLC.
-Which of the following is true about constructing PivotTables?
(Multiple Choice)
4.9/5 (32)
Use the data given below to answer the following question(s).
Following is an extract from the Employee Payroll Database of HFR Informatics Inc.
-What is the cumulative relative frequency of Ranks 1 and 2?
(Multiple Choice)
4.8/5 (34)
Use the data given below to answer the following question(s).
Following is the purchase order database of 'The Chef Says So', a restaurant in New York, over the last quarter (April-June).
-Explain statistics as defined by David Hand.What are the two ways in which Microsoft Excel supports statistical analysis?
(Essay)
5.0/5 (38)
Use the data given below to answer the following question(s).
Following is the Sales database of Pointler's Inc., a manufacturer of clothing material.
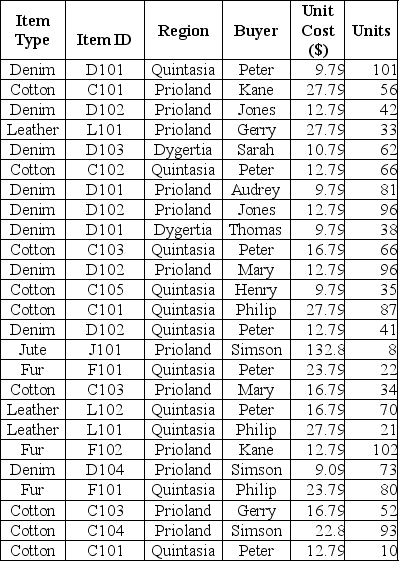 -Use Excel to calculate the total $ amount earned from sales of all denim items to Prioland
(Multiple Choice)
4.9/5 (37)
Use the data given below to answer the following question(s).
Following is the purchase order database of 'The Chef Says So', a restaurant in New York, over the last quarter (April-June).
-Specifying a Bin Range will allow Excel to automatically determine bin values for the frequency distribution and histogram.
(True/False)
4.7/5 (38)
Use the data given below to answer the following question(s).
Following is an extract from the Cost per Order Database of Grogtes LLC.
-Which of the following will give the value for the third quartile?
(Multiple Choice)
4.8/5 (38)
Use the data given below to answer the following question(s).
Following is an extract from the Cost per Order Database of Grogtes LLC.
-What is the rank of the 42ⁿᵈ percentile of the costs per order ?
(Multiple Choice)
4.9/5 (40)
Use the data given below to answer the following question(s).
Following is an extract from the Cost per Order Database of Grogtes LLC.
-Which of the following can be used to quickly create cross-tabulations?
(Multiple Choice)
5.0/5 (39)
Howard has screened some employee details out of the employee database for tax computation purposes.In order to restore the original data file, Howard must:
(Multiple Choice)
4.7/5 (31)
Use the data given below to answer the following question(s).
Following is the purchase order database of 'The Chef Says So', a restaurant in New York, over the last quarter (April-June).
-Changes to the type of chart, data included in the chart, and chart layout and styles can be made from the Layout tab.
(True/False)
4.9/5 (28)
Use the data given below to answer the following question(s).
Following is an extract from the Employee Payroll Database of HFR Informatics Inc.
-Which of the following represents the proportion of the total number of observations that fall at or below the upper limit of each group?
(Multiple Choice)
4.7/5 (23)
Which of the following charts provides a useful means for displaying data over time?
(Multiple Choice)
4.8/5 (37)
Use the data given below to answer the following question(s).
Following is the purchase order database of 'The Chef Says So', a restaurant in New York, over the last quarter (April-June).
-While constructing frequency distributions for numerical data, SUMIF is used to count the frequencies of each discrete value.
(True/False)
4.8/5 (34)
Use the data given below to answer the following question(s).
Following is an extract from the Cost per Order Database of Grogtes LLC.
-Which of the following observations is closest to the third quartile?
(Multiple Choice)
4.9/5 (32)
Filters
- Essay(0)
- Multiple Choice(0)
- Short Answer(0)
- True False(0)
- Matching(0)