Exam 3: Using Supply and Demand to Analyze Markets
Exam 1: Adventures in Microeconomics20 Questions
Exam 2: Supply and Demand148 Questions
Exam 3: Using Supply and Demand to Analyze Markets146 Questions
Exam 4: Consumer Behavior130 Questions
Exam 5: Individual and Market Demand146 Questions
Exam 6: Producer Behavior142 Questions
Exam 7: Costs179 Questions
Exam 8: Supply in a Competitive Market148 Questions
Exam 9: Market Power and Monopoly162 Questions
Exam 10: Market Power and Pricing Strategies165 Questions
Exam 11: Imperfect Competition172 Questions
Exam 12: Game Theory170 Questions
Exam 13: Factor Markets94 Questions
Exam 14: Investment, Time, and Insurance117 Questions
Exam 15: General Equilibrium97 Questions
Exam 16: Asymmetric Information106 Questions
Exam 17: Externalities and Public Goods114 Questions
Exam 18: Behavioral and Experimental Economics112 Questions
Select questions type
(Figure: Price and Quantity VII) Refer to Figure: Price and Quantity VII to answer the following questions. 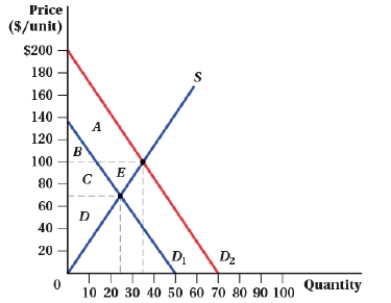 a. What is the area of consumer surplus before the increase in demand?
b. What is the area of producer surplus before the increase in demand?
c. What is the area of consumer surplus after the increase in demand?
d. What is the area of producer surplus after the increase in demand?
e. What is the area of the deadweight loss after the increase in demand?
a. What is the area of consumer surplus before the increase in demand?
b. What is the area of producer surplus before the increase in demand?
c. What is the area of consumer surplus after the increase in demand?
d. What is the area of producer surplus after the increase in demand?
e. What is the area of the deadweight loss after the increase in demand?
(Essay)
4.9/5  (45)
(45)
The market for cigars is characterized by QD = 10 - 0.25P and QS = 0.15P, where P is price per box of cigars and Q measures boxes per hour.
a. What is the equilibrium price of cigars?
b. Suppose the government taxes sellers $5 per box. What are the after-tax prices that buyers pay and sellers receive?
c. Suppose the government taxes buyers rather than sellers $5 per box. What are the after-tax prices that buyers pay and sellers receive?
(Essay)
4.8/5 (44)
In a small country, the demand and supply of kidneys are represented by QD = 10,000 - 0.25P and QS = 0.5P + 4,000. Which of the following statements is (are) TRUE?
I. The equilibrium price is $8,000.
II. At a price ceiling of $0, there are 4,000 volunteer donors.
III. At a price ceiling of $0, there is an excess demand of 14,000 kidneys.
(Multiple Choice)
4.7/5 (31)
In the market for used cars, the demand and supply equations are given by QD = 12,000 - 0.4P and QS = 0.1P + 5,000, where P is the price per car and Q measures the quantity of cars. What happens at a price floor of $20,000?
(Multiple Choice)
4.8/5 (36)
(Figure: Market for Gallons I) Figure: Market for Gallons I shows the effect of a government subsidy. Which of the following statements is (are) TRUE? 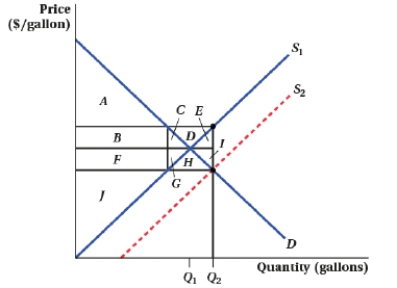 I. The area of the deadweight loss is C + D + E + G + H + I.
II) The subsidy causes producer surplus to increase from area F + G + H to area F + G + H + I.
III) The government's cost of the subsidy is area B + C + D + E + F + G + H + I.
IV) With the subsidy, consumer surplus is area A + B + C + D + E.
I. The area of the deadweight loss is C + D + E + G + H + I.
II) The subsidy causes producer surplus to increase from area F + G + H to area F + G + H + I.
III) The government's cost of the subsidy is area B + C + D + E + F + G + H + I.
IV) With the subsidy, consumer surplus is area A + B + C + D + E.
(Multiple Choice)
4.8/5 (36)
(Figure: Price and Quantity IV) At a price ceiling of $8, there is a shortage of _____ and a deadweight loss of _____. 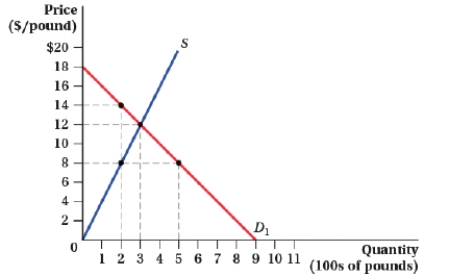
(Multiple Choice)
4.9/5 (31)
(Figure: Price and Quantity V) For demand curve D2, consumer surplus is $6,400 at a price of $40. Given this, the demand choke price for D2 is: 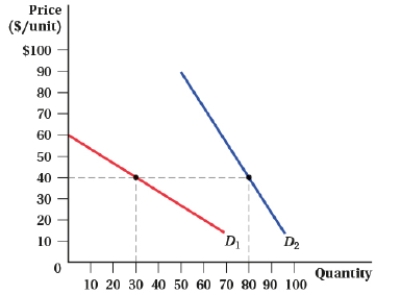
(Multiple Choice)
4.8/5 (38)
The supply and demand for solar panels are given by QS = 5P - 5,000 and QD = 15,000 - 5P, where P is price per solar panel and Q measures the quantity of solar panels. Suppose the government provides a $500 subsidy per solar panel. Before the subsidy, producers receive ____ and after the subsidy, producers receive ____.
(Multiple Choice)
4.8/5 (38)
In the market for cotton, the quantity demanded and quantity supplied are expressed mathematically as QD = 400 - 250P and QS = 250P - 100, where P is the price per pound of cotton and Q measures pounds of cotton. Suppose the government sets a price ceiling of $0.50 per pound of cotton.
a. How big is the shortage resulting from the price ceiling?
b. What is the level of consumer surplus with the price ceiling?
c. What is the level of producer surplus with the price ceiling?
d. What is the value of the deadweight loss associated with the price ceiling?
(Essay)
4.9/5 (36)
Suppose that a local government has imposed a quota of 0.5 million gallons on water usage. Before the quota is enforced, the market demand curve is given by
QD = 10 - 2.25P
And the market supply curve is given by
QS = -10 + 2.75P
Where the quantity is measured in millions of gallons per month and the price is in dollars per thousand gallons. The deadweight loss as a result of the quota is ____.
(Multiple Choice)
4.9/5 (37)
The demand and supply curves for Fuji apples are given by QD = 50 - 6P and QS = 4P - 2, where P is price per bag and Q is in thousands of bags. What are consumer surplus and producer surplus at the equilibrium price?
(Multiple Choice)
4.8/5 (40)
Juanita purchased a Polar Express train set from Lionel Trains. She paid $240 for the set and received consumer surplus of $125. What was Juanita's willingness to pay for the train set?
(Multiple Choice)
4.8/5 (31)
(Figure: Price and Quantity VII) The area that represents producer surplus with the demand curve D1 is _____, and the area that represents producer surplus with the demand curve D2 is ____. 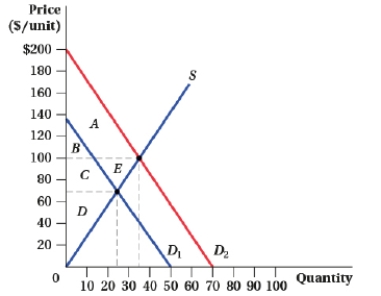
(Multiple Choice)
4.7/5 (39)
Suppose that the demand curve for brown rice is given by P = 50,000 - 3Q2, and supply is P = -10,000 + 3Q2. The consumer surplus at the equilibrium price is ____.
(Multiple Choice)
4.8/5 (40)
(Figure: Market for Peanuts II) If the government mandates a price floor of $750, the area of producer surplus changes from: 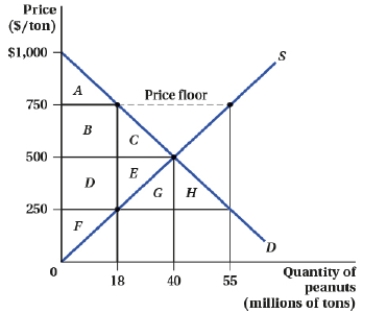
(Multiple Choice)
4.8/5 (28)
In a small country, the demand and supply of kidneys are represented by QD = 10,000 - 0.25P and QS = 0.5P + 4,000. The number of kidneys transplanted at a price floor of $10,000 would be _____.
(Essay)
4.9/5 (32)
(Figure: Price and Quantity II) The outward shift of the supply curve will cause producer surplus to increase from area _____ to area _____. 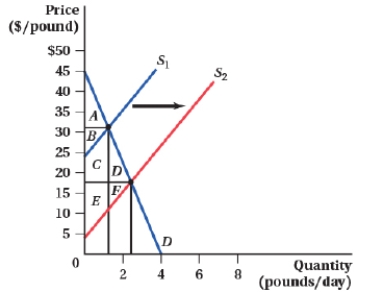
(Multiple Choice)
4.8/5 (38)
Suppose the market for soda is represented by the supply and demand equations:
QS = 35P - 39.75 and QD = 10.25 - 5P, where P is price per bottle and Q measures bottles per second.
a. What are the values of consumer and producer surplus?
b. If the government imposes a $0.50 tax per bottle, what are the values of consumer and producer surplus?
c. What is the deadweight loss from the tax? How much revenue does the tax yield?
(Essay)
4.8/5 (49)
Filters
- Essay(0)
- Multiple Choice(0)
- Short Answer(0)
- True False(0)
- Matching(0)